
Investment Thesis
The First Trust Nasdaq Food & Beverage ETF (NASDAQ:FTXG) is one of two factor-based Consumer Staples ETFs on the market, selecting 30-50 securities according to gross income, return on assets, and price momentum. However, these criteria are new and poorly advertised, considering First Trust’s website needs updating. Therefore, this article aims to clarify those changes and determine whether they benefit shareholders. For a fund that’s performed the worst in its category since its inception seven years ago, a change in methodology is undoubtedly worth a shot, so I look forward to taking you through how FTXG works in more detail below.
FTXG Overview
Strategy Discussion
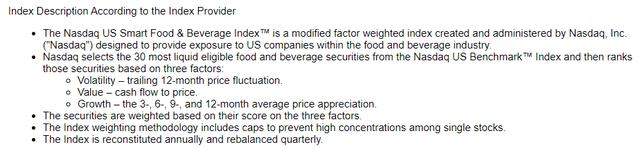
FTXG tracks the Nasdaq US Smart Food & Beverage Index, providing exposure to U.S. securities within the Food & Beverage sector according to Industry Benchmark Classifications. According to the methodology document, which changed effective March 20, 2023, the Index:
- Consists of 30-50 top factor-ranked U.S. food and beverage companies
- Scores securities that meet liquidity requirements based on gross income, return on assets, and price momentum (3, 6, 9, and 12-month returns)
- Weights securities so that allocations are between 0.5% and 8%
- reconstitutes semi-annually in March and September
As mentioned earlier, these criteria are different than before. Even FTXG’s fund page references incorrect and outdated screens, which include a security’s one-year price volatility, cash flow-to-price ratio, and the same price growth screen. I notified First Trust of the error and expect it will be resolved shortly.
First Trust
Performance Analysis
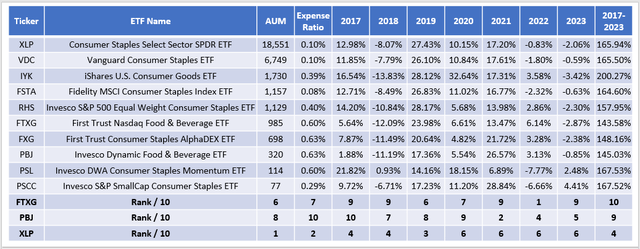
Notifying current and prospective shareholders is crucial, especially since FTXG’s historical performance is subpar. The change could breathe new life into a fund that has struggled since its September 2016 launch. To illustrate, here’s how FTXG ranked annually between 2017-2023 with nine other Consumer Staples-focused ETFs:
The Sunday Investor
Between January 2017 and May 2023, FTXG’s 143.58% total return ranked last, slightly behind the 145.03% return for the Invesco Dynamic Food & Beverage ETF (PBJ), which I covered numerous times last year. It’s no coincidence that the two are the only factor-based funds in the category. They work sometimes, but performance is inconsistent, as the chart above highlights. FTXG was the top performer in 2022, gaining 6.14%. However, it ranked second-worst four times (2017, 2018, 2021, and 2023 YTD) and was not worth a 0.60% expense ratio. FTXG still has positive YTD net fund flows of approximately $37 million. Still, investors have preferred the two straightforward S&P 500 Consumer Staples ETFs (XLP and RHS), with combined fund flows exceeding $1 billion YTD.
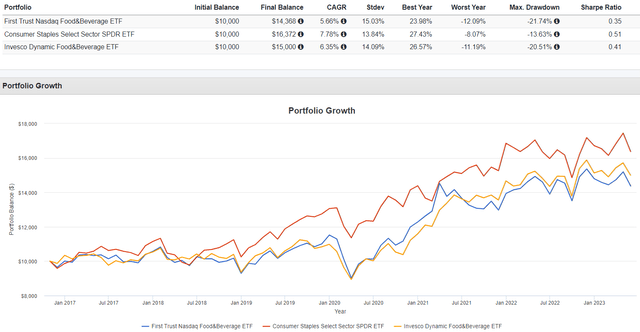
The graph below highlights FTXG’s performance since its inception through May 2023 and includes additional risk metrics. FTXG’s annualized standard deviation was 15.03% compared to 13.84% and 14.09% for XLP and PBJ. Recall how FTXG’s prior methodology included a volatility screen, so this result is disappointing. FTXG’s higher volatility also led to inferior risk-adjusted returns, as measured by the Sharpe and Sortino Ratios.
Portfolio Visualizer
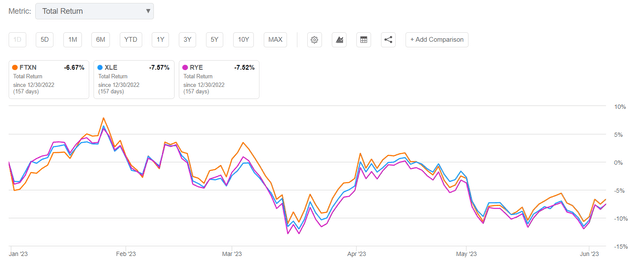
Still, the methodology change is refreshing because a volatility screen never made much sense for a Consumer Staples ETF. In my view, the primary reason for applying it was efficiency rather than in the interest of shareholders. First Trust has a suite of ETFs based on Nasdaq US Smart Indexes, and a volatility screen is better suited for others in the lineup, like the First Trust Nasdaq Oil & Gas ETF (FTXN). FTXN is the leading Energy ETF this year, declining by 6.67% YTD compared to 7.57% and 7.52% for XLE and RYE.
Seeking Alpha
Readers should always determine if an ETF applies a blanket approach to selecting stocks and be skeptical about suites of funds that aren’t designed with your investment objectives in mind. Investors should only pay a premium for an ETF that sufficiently improves on the weaknesses of low-cost alternatives like XLP. In this case, we’re looking for improved valuation and growth metrics without sacrificing much on volatility and profitability, as XLP is already strong on those factors.
FTXG Analysis
The following table highlights selected fundamental metrics for FTXG’s top 25 companies, totaling 97% of the portfolio. For comparison purposes, I included summary metrics for PBJ and XLP and created a “pre-reconstitution” portfolio based on current metrics for FTXG’s holdings on December 31, 2022. This comparison allows us to see any differences between the two approaches.
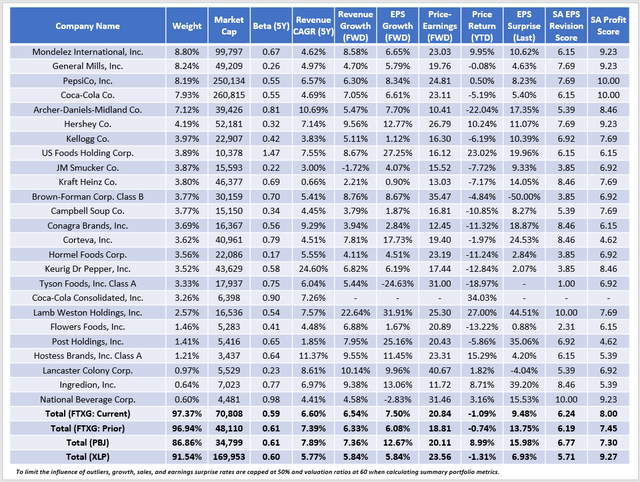
The Sunday Investor
A few observations:
1. FTXG’s volatility, as measured by five-year beta, hardly changed. Today’s portfolio has a lower beta than before the methodology change, so I’m confident it was a wasted screen. Nearly all constituents, including Mondelez International (MDLZ) and General Mills (GIS), have betas below one, with US Foods (USFD) as the key exception. In this case, restaurant-dependent companies like US Foods and Sysco (SYY) experienced much higher volatility through the pandemic. In US Foods’ case, its annualized standard deviation for the 3.5 years since January 2020 was 49.78% compared to 20.99% for the 3.5 years prior, per Portfolio Visualizer.
2. FTXG trades at 20.84x forward earnings, up two points compared to the prior portfolio. The increase makes sense because the Index no longer screens for cash flow to price. Now, it’s on par with PBJ and still almost three points cheaper than XLP. Estimated sales and earnings growth increased, but it’s probably random since it’s not linked to the methodology change. Still, the earnings growth gap with PBJ is large (7.50% vs. 12.67%).
3. The significant change is in profitability, as measured by Seeking Alpha Profitability Score on a normalized ten-point scale. FTXG scored 8.00/10, up from 7.45/10 for the prior portfolio and beating out PBJ’s 7.30/10. I link this to the return on assets screen. Also, FTXG’s gross income screen favors larger companies, reflected in the higher $71 billion market capitalization figure.
4. FTXG kept its price momentum screen, but its constituents’ YTD price return was only slightly better than XLP’s (-1.09% vs. -1.31%). It may be because large-cap stocks have generally outperformed lately, and I would not be surprised to see this change as the year progresses.
Investment Recommendation
FTXG underwent a methodology change in March 2023 that the ETF provider didn’t highlight well. After comparing First Trust’s description with the latest Index methodology document, I determined that Nasdaq US Smart Indexes removed a volatility and valuation screen and replaced it with two profitability-focused screens: gross income and return on assets. As a result, FTXG’s valuation suffered slightly, but its profitability score increased to 8.00/10, and it’s no longer such a glaring weakness. It’s no coincidence that FTXG and PBJ, another multi-factor fund with a profitability problem, performed first- and second-worst among Consumer Staples ETFs over the last six years. While it’s far too early to issue a buy recommendation without seeing the results of future reconstitutions, it’s a step in the right direction.
However, this may not be true for other ETFs in First Trust’s lineup that follow these Smart Indexes, like the ones below.
- First Trust Nasdaq Oil & Gas ETF (FTXN)
- First Trust Nasdaq Semiconductor ETF (FTXL)
- First Trust Nasdaq Bank ETF (FTXO)
- First Trust Nasdaq Pharmaceuticals ETF (FTXH)
- First Trust Nasdaq Transportation ETF (FTXR)
For instance, a return on assets screen would likely have eliminated many regional bank screens from FTXO. However, the new profitability screens will have less impact on FTXH because the iShares U.S. Pharmaceuticals ETF (IHE) already has a solid 9.16/10 profitability score. Keep this in mind as you research ETFs, and if you would like more detailed coverage on any of the above funds, please let me know in the comments below.
Read the full article here

