Fidelity Value Factor ETF (NYSEARCA:FVAL), launched on 09/12/2016 and managed by Fidelity Management & Research Company LLC, is an ETF that tracks the performance of the Fidelity U.S. Value Factor Index.
This ETF serves as a reminder that large-cap/mid-cap funds are more accommodating in regard to AUM size rather than meaningful outperformance. While the methodology is sound (for the most part), the focus on large-cap stocks as well as an expense ratio of 0.15% will probably not allow this ETF to deliver enough value to investors. There is also a high concentration risk; similar to that of an S&P 500 fund. So, I believe that there is a better option available for long-term value investors, which I encourage you to examine at the end of this article.
Methodology
The index that this ETF tracks is all about measuring the performance of large-cap and mid-cap stocks in the U.S. that are considered undervalued based on multiple indicators.
It uses a ranking system to select stocks by calculating a composite score for each one. The indicators it uses are free cash flow yield, EBITDA/EV, tangible book value to price, and earnings yield based on forward earnings. For banks, the index applies only the last two metrics. In each case, the indicators have an equal-weighted impact on the score.
The scores are calculated separately within each industry group and then they are combined at the sector level. Last, the index applies a size adjustment to remove size bias and then each stock is attributed a weight according to its market cap, subject to an overweight adjustment.
Performance & Cost
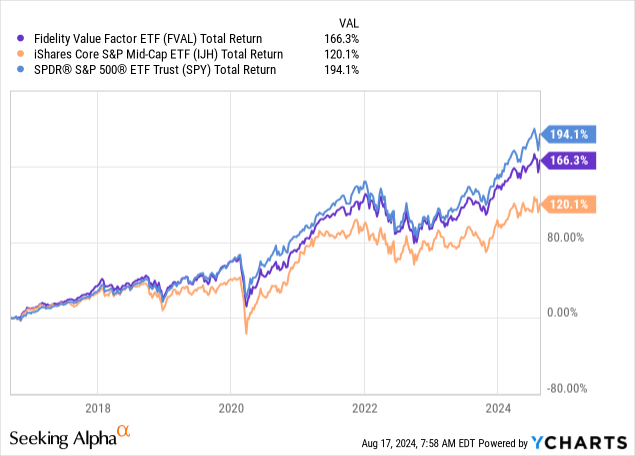
In the last five years, VFAL has returned an annualized return of 13.18%. That’s a decent performance, but the track record we have available makes any comparisons to vanilla alternatives as meaningful as the context of the past eight years allows.
Since its inception, VFAL outperformed mid-cap stocks by a large margin but underperformed large-cap ones, albeit by a smaller margin:

This period is not indicative of the underlying methodology’s potential, however, because a significant contributor to the excess returns observed in value stocks is the recovery period after a bear market. We need more than one to improve the statistical significance of the results.
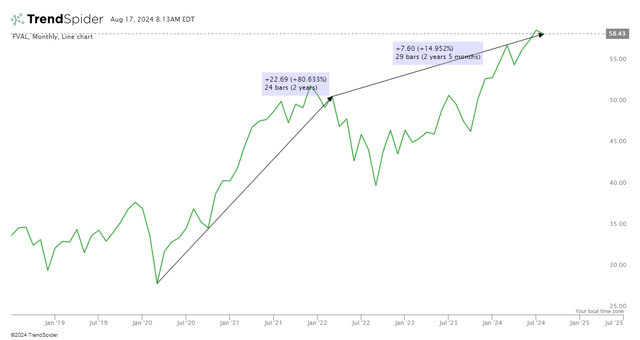
Regardless, FVAL’s recovery from the 2020 low up to when the Fed rate hikes started has been dramatic and it has more than recovered since March 2022 as well:
TrendSpider
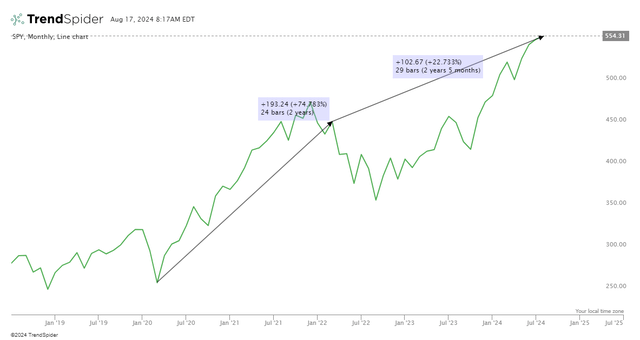
It did only a bit better than the market during the first phase and worse in the second one:
TrendSpider
But again, it’s not a race but a marathon. I don’t think the last eight years provide us with a meaningful track record. However, that’s not my problem with this fund. If the methodology is sound, that’s enough for me to believe it will do well given enough time based on the accumulating evidence of the performance spread observed in value strategies in the long term. But I think that because of the exposure to large-cap stocks, the valuation isn’t as low as in the case of other value ETFs.
Its price-earnings ratio is currently 18.8 and its P/B ratio at 2.94. SPY currently has 22.89 and 4.65, respectively which are significantly higher, however. That may be enough for FVAL to outperform but I believe that the expense ratio of 0.15% is high for what’s offered. It is not unfair but simply not low enough for the potential narrow performance spread that is usually offered when value is not accompanied by a size bias as well.
Risks
The most present risk for me is, therefore, an opportunity cost. Such fees applied annually can have a significant impact on your performance spread over time and it may be a better idea to pay them for the full suite of factors supported by the greatest explanatory power (undervaluation, high quality, and small size). If the small size presents a risk too high for you, a broad-market index fund is the better option here because the chance of underperformance in the long run is higher with FVAL than with other value funds.
Besides, this ETF carries almost as much concentration risk as SPY, having almost one third of its portfolio exposed to Technology. Apple (AAPL) and Microsoft (MSFT) also have a 7.66% and 7.21% weight, respectively, which indicates anything but a value approach. If you are to take such a concentration risk, why not take it with a broad-market index fund instead of attempting value investing but not going all the way (which is what this ETF is guilty of)?
Verdict
In conclusion, I think that FVAL seems good in theory but it will be hard for it to deliver in the future. So I am rating it a hold and I encourage you to read my previous article on SPDR S&P 600 Small Cap Value ETF (SLYV), which has the same expense ratio, a much longer track record to examine, and a small-cap bias. It doesn’t have a quality bias but it’s very cheap for what it offers.
What’s your opinion? Do you own this ETF or prefer something else? Let me know in the comments and I’ll get back to you soon. Thank you for reading.
Read the full article here


