The objective of this article is to show, based on public information and historical patterns, that is likely that the evolution of global liquidity turns into a significant headwind for markets and that should warrant a defensive stance for the remainder of the year. My attempt is to provide an exercise that hopefully is more valuable than the bearish outlook, as all will be done using very specific assumptions that should allow the reader to monitor the actual evolution of the tracked variables against those stated assumptions.
This is my second article regarding liquidity, and if you want to understand why liquidity is a material driver of asset price evolution, I am linking again the thread by Andy Constan that I used the last time.
The thesis of that previous article was related to the impact of the tax season driven TGA buildup. And roughly a month later, as you can see in the following image, I updated that article as tax season proved to be clearly underwhelming, and consequently, the impact on liquidity more muted.
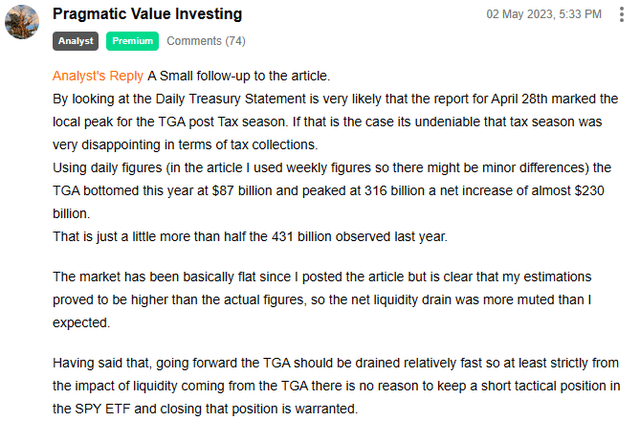
Seeking Alpha
One important difference between this and the previous article is the definition of liquidity that I will be using. On the first one I used an adjusted version of the more usual definition that you can find on Fintwit, the one that tracks the FED Balance Sheet, the Reverse Repo Facility, and the Treasury General Account.
Today I will start with that same adjusted definition (Assets Held Outright – Treasury General Account – Reverse Repo Facility – Remittances Due to US Treasury) and I will be adding the balance sheets of 6 other central banks that in order of importance are the following:
The European Central Bank (ECB), The Peoples Bank of China (PBoC), The Bank of Japan (BOJ), The Bank of England (BOE), The Switzerland National Bank (SNB), The Reserve Bank of Australia (RBA) and the Bank of Canada (BOC). In the cases of the ECB, the PBoC, the BOJ and the SNB the balance sheets specify as liabilities the accounts of their respective governments, so following the logic used for the TGA I would deduct those amounts from the total assets of each of those institutions as that liquidity is considered “trapped” until it is spent into the economy.
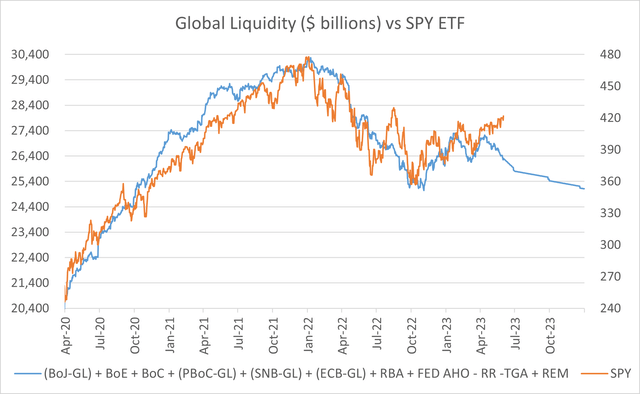
The Following charts show that the broader definition of liquidity does a much better job at tracking market performance as defined by the SPDR® S&P 500 ETF Trust (NYSEARCA:SPY).
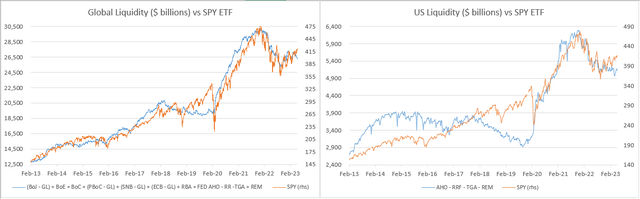
St Louis FED, ECB, BOE, SNB, BOJ, PBoC, RBA, BOC
And the following ones also reaffirm this point and importantly, global liquidity is starting to show one of the widest gaps against market performance since the start of the pandemic.
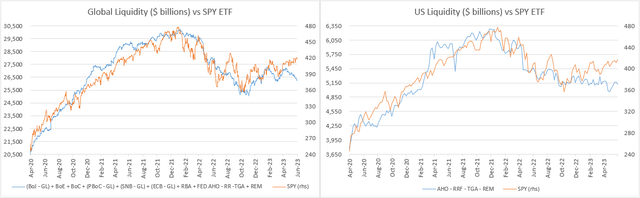
St Louis FED, ECB, BOE, SNB, BOJ, PBoC, RBA, BOC
The idea of this article is to try to project this measure of global liquidity for the remainder of the year under the following assumptions:
- A continuation of the stated QE or QT programs already in place in each of the central banks being tracked.
- An assumption for the early repayment of the TLTRO III program of the ECB in the next three windows scheduled for this year. Those should settle on June 28, September 27, and December 12, respectively.
- The maturity of the Term Funding Facility (TTF) of the RBA according to the conditions of the program.
- An assumption for the buildup of the TGA under the projections of the latest refunding plans of the US treasury.
QE and QT programs of each central bank
FED (QT): $95 billion per month minus the weekly increase in the losses that are being accrued by the FED at monthly rate of roughly $12 billion per month and are paid to the remunerated liabilities of the fed with new money. So, a net of $83 billion per month of QT.
ECB (QT): EUR 15 billion per month (the amount after June is subject to change as you can see in the 4th paragraph of the transcript of this speech)
SNB: No QE or QT program in place.
BOE (QT): GBP 80 billion per year or $8.2 billion per month.
BOJ (QE): JPY 12.18 trillion yen per year that at current exchange rates amount to around $7.4 billion per month. That amount relates to their plans regarding the purchases of ETFs and J-REITs and I disregarded their plans to return the amount outstanding of corporate bond to a level of 3 trillion yen from today’s more than 7 trillion yen as that is a relatively minor amount that is changing at an immaterial pace.
PBoC: No explicit QE or QT program in place.
BoC QT: Starting on April 2022 the bank stopped all reinvestments. There is no explicit periodic monthly rate of reductions but since the start of QT the balance sheet has been reduced at a relatively stable rate of approximately CAD 8.5 billion or $6.25 billion and that same monthly amount will be used looking forward.
RBA QT: On May 2022 the RBA decided to start their QE process by letting their assets mature. The process is slow and for this year of all the roughly AUD 15 billion of expected bond maturities seem to already have happened. The next phase of their QT program relates to the maturity of the TTF. The portion related to the initial allowance (AUD 84 billion) is set to expire on September 30 of this year. The Additional portion that is roughly of the same size is set to expire on June 30 of next year. So, the only impact for this year coming from the RBA should be of roughly $55 billion on September 30.
Assumptions related to the TLTRO III program from the ECB.
The TLTRO III is a program that had the objective of supporting the flow of credit by providing low-cost financing to the financial institutions of the EURO zone. The program peaked at a little more than EUR 2.2 trillion by mid-2021 and stayed relatively flat until the end of 2022 when the ECB decided to increase the cost of the amounts drawn to incentivize the early repayment as they battled high levels of inflation. Concurrently, they opened new windows for the early repayment and the following table show the evolution of the amounts repaid and my assumptions of repayment for the 3 remaining windows of this year.
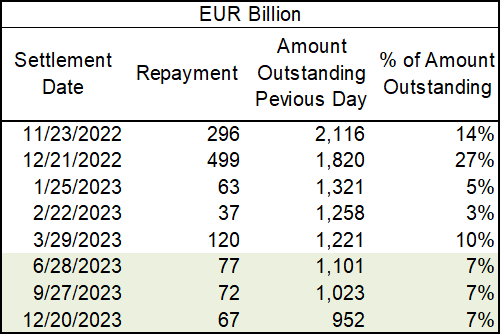
ECB and author assumptions
As you can see, the first 5 windows had just a month between them as the ECB tried to give more flexibility for repayment after the change in conditions. But now we have returned to the normal schedule of quarterly windows, so the coming one is the first after 3 months without prepayments. Anyhow I tried to be conservative and assumed a lower percentage of the outstanding amount as prepayment for the next three windows. But to be clear, those amounts are just an educated guest based on the previous 5 observations.
The TGA Buildup
With the approval of the agreement to lift the debt ceiling and the TGA standing at below $23 billion at the close of May 1st we should see a material buildup in line with the latest Treasury Quarterly Refunding.
According to that report, they expect to end the quarter at a level of $550 billion, so that would be a huge buildup of $527 billion, but the composition of the issuance to get to that level is important as a portion of it might be satisfied with money that today is trapped in the RRP.
The last two reports of the TBAC Recommended Financing Tables have the following composition for net issuance.
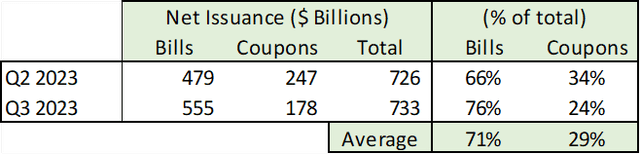
US Treasury
So, it would be reasonable to assume that roughly 70% of that buildup is coming from treasury bills that can compete with the RRP, exactly what portion of the bill issuance will be satisfied by the RRP is not that easy to say, but the following chart shows that net bill issuance and the RRP tend to follow an imperfect mirror pattern.
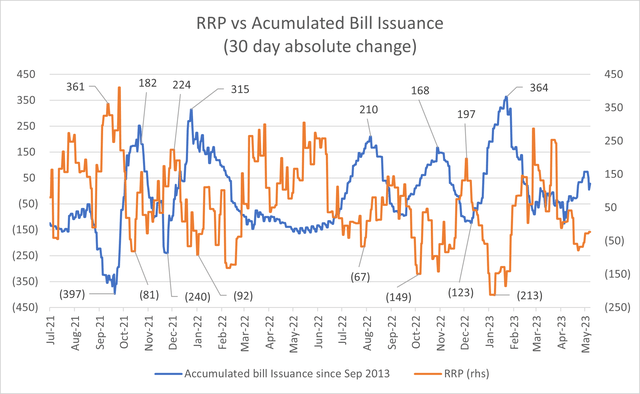
St Louis Fed and US Treasury
The relationship is messy, but by looking at the last 5 buildups in net bill issuance it seems reasonable to assume that half of the coming one should be satisfied by liquidity trapped in the RRP.
With that, the buildup of the TGA should translate to a net reduction in liquidity of approximately $342 billion (all of the net coupon issuance plus half of the net bill issuance).
The Known Unknowns
The following chart shows the evolution of total assets minus liabilities with their respective governments of the BOJ and PBoC. And as you can see, both have had very significant movements in both directions since the start of the pandemic.
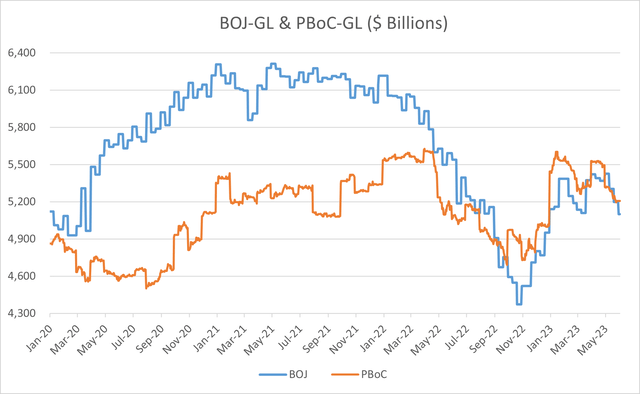
BOJ and PBoC
It’s true that the same can be said for many other of the central banks under analysis, but there is a big difference. For the rest, a very big portion of their movements have been clearly telegraphed in advance, so most of their actions were to a large degree predictable, and that is not the case for the BOJ and even less so for the PBoC.
In the case of the BOJ, the big increase of roughly $1.1 trillion from the end of October 2022 to February 2023 was mainly related to the testing by the market of the Yield Curve Control policy of Governor Kuroda that necessitated the acquisition of huge amounts of JGBs. That dynamic ended, at least for now, as the BOJ adjusted their YCC policy by increasing the band for the 10-year bond from +/- 0.25% to +/- 0.50% and as global yields moderated from their peaks of late 2022 reducing the pressure against their policy.
But conditions can certainly change looking forward, especially with a new governor leading the institutions after the decade long tenure of Kuroda, so this is a known source of uncertainty for this exercise.
In the case of the PBoC, the huge increase of approximately $800 billion that occurred in parallel to the jump observed for the BOJ was mainly related to the desire of the government to stimulate the economy after the long zero covid policy came to an end. Lately, the economic data coming from China has disappointed on a consistent basis and that could motivate a new jump in liquidity, but in the end, it depends pretty much on the ideas of a single individual, Xi Jinping. Anyhow, for the last decade the balance sheet of the PBoC has increased at an annual CAGR of 3% and to be conservative I will assume double that annual rate (6%) looking forward. That would equal $208 billion from the last report (April) up to the end of the year.
With all those assumptions, the original chart of global liquidity against the market would look like this.
St Louis FED, ECB, BOE, SNB, BOJ, PBoC, RBA, BOC and author projections
The projected line of global liquidity seems unnaturally straight as I used a uniform daily rate of change for all of the QE and QT program. That clearly won’t be the case as there normally is variability within each month, but the important thing is that with some volatility (not incorporated in my projection) there should be a net reduction of global liquidity of roughly $1.2 trillion for the rest of 2023.
Conclusion
Under the specified assumptions, the future path of global liquidity presents a significant risk to the evolution of markets, and even today there seems to be a material gap between the evolution of markets and the actual figures of global liquidity. Consequently, a defensive stance seems appropriate.
As I stated in the introduction, I hope that the presented exercise is more valuable to the reader than the bearish outlook. As you need to keep in mind that the conclusions derived from the exercise are only as good as the underlying assumptions, but the reader can easily track those against their actual evolution.
Finally, is important to point out that the stated plans of the different central banks are not carved in stone and can be changed at any moment. But considering the still elevated global inflation and the relatively benign recent evolution of markets I think that most should continue unchanged, at least in the absence of material systemic risks to their respective financial systems. In any case, I would try to update the article in the comments if there are material changes to the presented assumptions and to check if the more specific events (TLTRO III prepayments and TTF maturities) go as expected.
As you can see, there are many moving parts in this exercise, and I might have made a mistake or ignored a significant event, deadline, or plan. So obviously I am more than open to constructive criticism or debate.
Thanks for reading and good luck with your investments.
Read the full article here

