Thesis
Gold Fields (NYSE:GFI) is one of the major gold miners. It has operations in six countries across four continents. African and Australian assets contribute over 80% of annual output and cash flows. In H1, Gold Fields reported a 4% year-over-year decline in gold production, while AISC jumped 6% to $1,215/oz, hit by skilled labor shortages, lower grades, and continuing inflation.
Unfavorable ground conditions at South Deep also influenced its H1 performance, causing guidance to be marginally revised downward and a postponement of the 380,000-ounce steady-state target to H2-2025. Gold Fields has two quality projects in its pipeline: Salares Norte in Chile, which is almost finished, and Windfall, which will probably receive environmental licenses in less than a year.
GFI operates in six countries, which significantly heightens the operational risk. I prefer companies focused on one region or continent in a few countries. Agnico Eagle (AEM) is a great example, with its flagship mines in Canada and Australia. Its Mexican and Finnish assets contribute 8% of the company`s revenue. Another good example is Endeavour Mining (OTCQX:EDVMF); despite its mines being in a highly political risk region like the Sahel, the company has developed profound expertise in handling West African complexities and uncertainties.
GFI has an excellent balance sheet, pays dividends with adequate yield, and is for sale at a steep discount, even using gold spot at $150/oz. I give Gold Fields a buy rating instead of a strong buy only due to its overextended operations in six countries.
Q2 results
Last half, Gold Fields reported gold production of 577,000 ounces and H1 2023 output of 1.15 million ounces, a 4% decline compared to 1H22. The chart from the last company presentation below illustrates the last report highlights.
Gold Fields presentation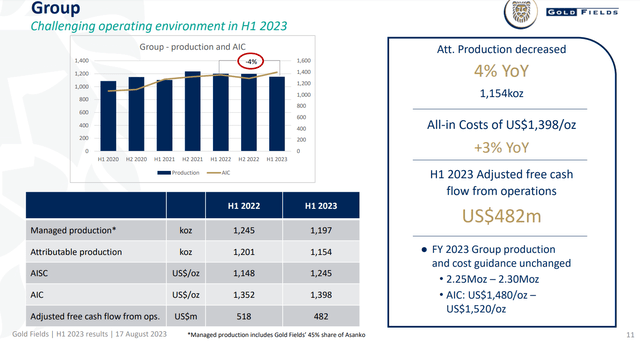
The decline came from GFI Australian and African mines. Its Australian segment output dropped by 3%, its South Deep Mine in South Africa by 5%, its Ghanaian operations by 6%, and its JV Asanko Mine produced 28% less. Lower grades at most Australian and African mines contributed to declining output. Another issue is the shortage of skilled labor and an incident in a mine in South Africa. This decline was partially offset by a 4% increase in output from its Cerro Corona Mine in Peru. However, this couldn’t compensate for the lower production across the remainder of the portfolio.
Reduced output at two major mines, Agnew and St. Ives, offset higher production at Gruyere (50%) and Granny Smith at its Australian operations.
Gold Fields presentation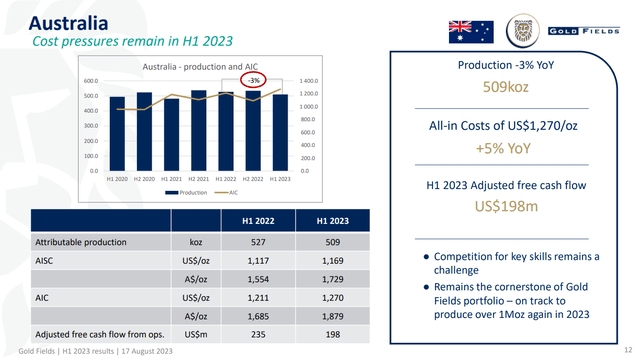
Gold Fields’ AISC in Australia increased yearly to $1,169/oz. The primary driver for that is the shortage of mining workers. According to Gold Fields, a lack of skilled workers and churn in important positions has increased mining expenses as wages rise. Even though Gruyere had a better first quarter than the previous year, guidance has been lowered from 355,000 ounces at the midpoint to 335,000 ounces, and cost projections have also increased.
Let’s look at West African operations, starting with Ghana.
Gold Fields presentation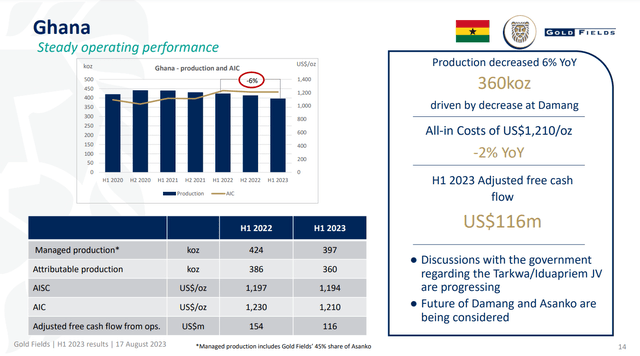
Tarkwa produced about 297,700 ounces in H1 at an AISC of $1,181/oz, with output up 12% annually and costs down 10%. Due to higher grades of gold and a lower strip ratio, the business was able to generate $97.5 million in adjusted free cash flow despite higher CAPEX. Unfortunately, its other West African operations countered the improved output and margin gain, with Damang experiencing a 38% grade decline and a 37% output decline. Thus, AISC rose from $884/oz to $1,193/oz.
As shown on the chart below, South African operations had lower output with 5%, and AISC grew to $1,387/oz.
Gold Fields presentation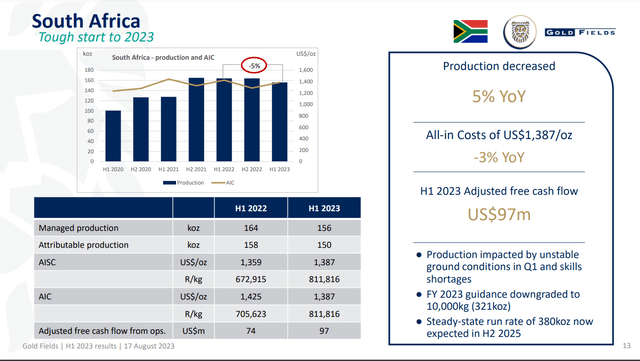
One of the reasons is a fatal incident caused by unstable ground conditions. Another persisting issue is the shortage of competent operators for long-hole-stop drill rigs, and the problems that existed earlier in the quarter persisted into Q2. Despite that, free cash flow increased year over year by 31% to $96.6 million due to decreased capex caused by production delays. Gold Fields was forced to lower its previous projection of 347,000 ounces to 321,500 ounces.
GFI has a few projects in its pipeline to boost its profitability. Salares Norte Mine is expected to go into production in H2 2024. Assuming a 15-month schedule, Gold Fields also mentioned that the Windfall project JV with Osisko had progressed. GFI submitted an Environmental Impact Assessment in March, expecting a June 2024 clearance. Windfall mine would be on track to begin production by H2 2026 with 160,000 ounces of annual output at AISC below $800/oz.
Company Financials
GFI has one of the best balance sheets in the industry. The table below shows a few solvency and liquidity metrics I use to assess company financials. The data is taken from the last financial report.
|
EBITDA/Interest expenses |
44 |
|
EBITDA – CPX/Interest expenses |
23 |
|
Quick ratio |
0.51 |
|
Current ratio |
1.57 |
|
Net debt/EBITDA |
0.46 |
|
Net debt/EBITDA – CPX |
0.86 |
|
Long-term debt/Equity |
11.0% |
|
Total debt/Equity |
38% |
|
Total liabilities/Total assets |
43.2% |
All precious metal miners improved their balance sheets, but GFI is among the best. Despite the adequate CAPEX, the company maintains excess liquidity. Another positive sign is the low ratio of Net Debt to EBITDA.
GFI capital expenditures deserve special mention. I use CPX to Market Cap, CPX to depreciation, depletion, and amortization ((DDA), and CPX to Operational Cash Flow (OCF) to estimate how sufficient a company`s capital investments are. The table below compares Gold Fields, Endeavour Mining, and Barrick Gold. The data is taken from the last financial report.
|
CPX/Market Cap |
CPX/DDA |
CPX/OCF |
|
|
Gold Fields |
10.6% |
115% |
67% |
|
Endeavor Mining |
14.4% |
72% |
84% |
|
Barrick Gold |
12.3% |
122% |
99% |
The most crucial metric is CPX/DDA. It must be higher than 100%. That means the company’s investments in Property, Plant, and Equipment (PPE) exceed mining assets depletion, PPE depreciation, and intangible assets amortization. GFI is doing a great job; for every dollar sunk in DDA, the company invests $1.15. Besides that, GFI spends only 67% of its operational cash flow to maintain such a stable ratio. That said, the company has available firepower for more investments or to return to shareholders with dividends and share buybacks.
GFI excels on performance metrics, too. The table below shows a few profitability figures I use to estimate the company`s efficiency. The data is taken from the last financial report.
|
FCF/EV |
4.6% |
|
Sales/EV |
39.7% |
|
FCF Margin |
10.9% |
|
Gross Margin |
36.6% |
|
ROI |
13.9% |
|
ROE |
14.4% |
|
Net income per Employee |
$106,960 |
All metrics are notably higher than the industry`s average and GFI’s year average. Sales/EV and FCF/EV illustrate the entry and exit points of the company`s cash flows. Both metrics show GFI`s ability to convert revenues into free cash flow.
Gold Fields pay dividends with adequate yields higher than the industry average. The table below compares GFI with other major miners with exposure to Africa.
Seeking Alpha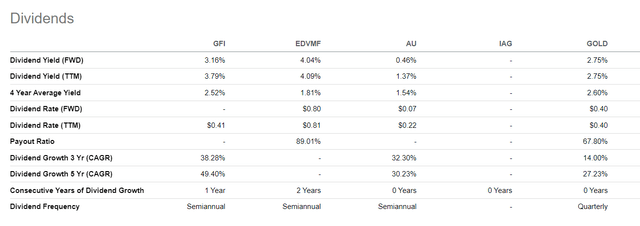
Valuation
Goldfields is a gold miner, and as such, I use three valuation methods:
- Net asset value based on the company`s plausible reserves, current assets, and total liabilities.
- Conventional comparison based on EV/Sales and Price/Cash Flow
- Miners special assessment weighting up EV to Annual production, EV to Plausible reserves, Plausible reserves to Fully diluted shares
I calculate net assets as follows:
NAV = PR*(SP-AISC) + cash + inventories + total receivables – total liabilities
PR (plausible reserves) = 100% * P&P Reserves + 50%*M&I Resources + 30%*Inferred Resources
Author`s database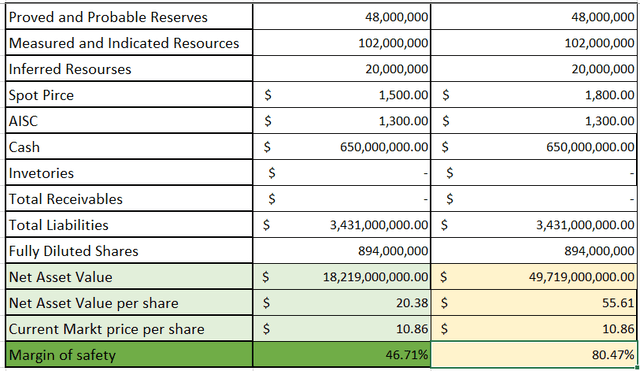
I examined two scenarios. One conservative with spot gold 1500 $/oz. The other is the base scenario using the 1800 $/oz price.
Conservative NAV per share = $ 20.38
Base NAV per share = $ 55.61
Current Market Price = $ 10.86 on Sept 29, 2023
Even using 1500 $/oz gives an adequate margin of safety at 46%. However, using base case figures, GFI’s margin of safety moves to 82 %.
The image below compares Kinross with the following companies:
- Endeavour Mining (OTCQX:EDVMF)
- AngloGold Ashanti (AU)
- IAMGOLD Corporation (IAG)
- Barrick Gold (GOLD)
Seeking Alpha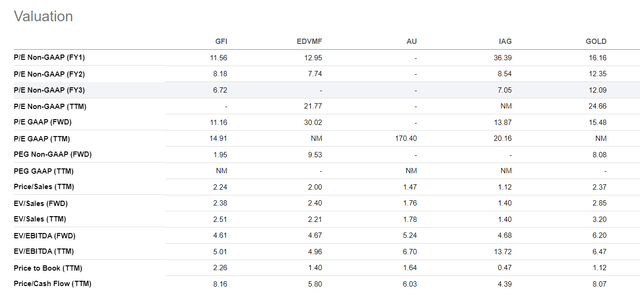
Comparing GFI to other miners using EV/Sales and Price/Cash Flow is second most expensive to GOLD. Last but not least is to compare GFI based on EV/annual production, EV/Plausible reserves, and Plausible reserves/Fully diluted shares.
Author`s database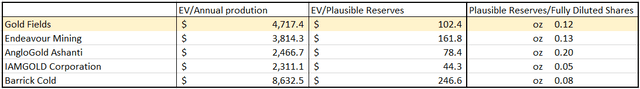
Investors pay $4,714/oz per ounce of annual production and $102/oz per ounce of plausible reserves. Besides, we get 0.12 ounces of gold by buying one GFI share. Like financial multiples using EV/Annual production metrics, GFI is second to GOLD; however, the other two hold the middle ground between EDV and AU based on EV/PR and between GOLD and EDV based on PR/FDS, respectively.
Risk
The typical risks for miners are metallurgical, geological, financial, and country. Given the successful operation and expansion of its current projects, GFI handles mining-specific risk well in the face of geology and metallurgy. Its financial standing is excellent, too.
The country risk is well diversified between Australia, Ghana, South Africa, Chile, and Peru. However, as I said earlier, operations scattered across several countries represent significant operational challenges. Even politically stable countries can have obscure and complex mining regulations. The laws differ considerably from state to state in the US and between the provinces in Canada, which is what remains between different countries. This represents a challenge for any management team.
Conclusion
Gold Fields is an excellent major gold miner. The company carries a solid balance sheet, its profitability is above average, and it pays dividends with adequate yield. GFI has two incoming projects to boost current performance. Estimating GFI`s NAV with the spot price of $1500/oz, the current share price offers a considerable margin of safety at 46%. Using financial multiples Gold Fields is relatively more expensive, though measured with mining multiples holds the middle ground. The sole disadvantage is the company`s operations in six countries on four continents. It reduces single-country risk at the cost of increased operational complexity. Given all the facts, I give GFI a buy rating.
Read the full article here

