
October in review
- Gold gained 6.8% in October, reversing an early-month slump to finish at US$1,997/oz, the highest ever monthly close for the LBMA PM price
- Safe-haven flows driven by geopolitical tensions partly captured by strong inflows into COMEX futures were likely behind the move.
Looking forward
- COMEX net shorts reversals are a historically reliable positive signal for gold prices, and have tended to lead ETF flows
- A sustained rally in gold will in our view require either: continued or worsening political risk, a peak in bond yields and the US dollar, or an equity bear market combined with revived recession risks
Record month-end finish
Gold prices started the month on the backfoot, having fallen below US$1,850/oz at the end of September. The events in Israel on 7 October set a rally in motion that took the US dollar price back up above US$2,000/oz by 27 October. The record-high monthly finish was mirrored in almost all other major currencies (Table 1).
Our gold model GRAM attributed the bulk of this move to the residual, in this instance likely capturing a spike in geopolitical tension, which we discussed in a recent blog (Chart 1). The large contribution from a rise in implied volatility and breakeven inflation rates as well as the strength in the Swiss Franc (not in our model) pointed to safe-haven flows as a dominant motive. In addition, COMEX futures also weighed in, with short covering (-87t) and new longs (+84t) taking net longs higher by 171t (US$11.3bn).
Despite positive flows in futures, global gold ETFs saw another month of outflows (-US$2.2bn, -38t), two thirds from North America and one third from Europe. By the end of the month, flows appeared to have troughed with a small pick-up towards the end of the month partly driven by options expiry in the US.
Chart 1: Gold driven higher by geopolitical risk and safe-haven buying*
*Data to 31 October 2023. Our Gold Return Attribution Model (GRAM) is a multiple regression model of monthly gold price returns, which we group into four key thematic driver categories of gold’s performance: economic expansion, risk & uncertainty, opportunity cost, and momentum. These themes capture motives behind gold demand; most importatntly, investment demand, which is considered the marginal driver of gold price returns in the short run. ‘Unexplained’ represents the percentage change in the gold price that is not explained by factors currently included in the model. Results shown here are based on analysis covering an estimation period from February 2007 to October 2023. (Sources: Bloomberg, World Gold Council;)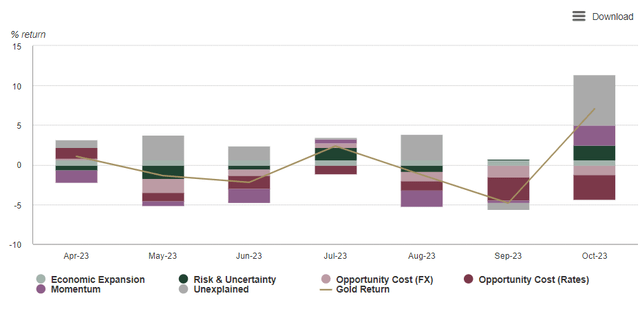
Table 1: Gold prices closed on a month-end high in all major currencies but the Swiss franc
Gold price and return in different periods across key currencies*
| USD (oz) | EUR (oz) | JPY (g) | GBP (oz) | CAD (oz) | CHF (oz) | INR (10g) | RMB (g) | TRY (oz) | AUD (oz) | |
| 31 October 2023 price | 1,997 | 1,888 | 9,738 | 1,643 | 2,771 | 1,818 | 53,452 | 470 | 56,516 | 3,151 |
| October return | 6.8% | 6.7% | 8.4% | 7.2% | 9.1% | 6.2% | 7.0% | 7.0% | 10.2% | 8.4% |
| Y-t-d return | 10.1% | 11.5% | 27.4% | 9.5% | 12.7% | 8.4% | 10.8% | 16.8% | 66.5% | 18.4% |
*Data to 31 October 2023. Based on the LBMA Gold Price PM in USD, expressed in local currencies.
Source: Bloomberg, ICE Benchmark Administration, World Gold Council
Looking forward
- The net short in COMEX futures, which occurred in early October, has a good history of producing positive subsequent returns for gold, and ETFs have tended to take their cue from futures
- But a fully-fledged return to flows into both sectors is probably in need of a convincing trigger, given high real yields, the firm US dollar and resilient US economy
- In our view, a sustained turnaround for investment will require one or more of the following:
- The geopolitical environment stays volatile or gets worse
- Equities enter a ‘bear market’ and/or recession risks rise again
- Bond yields peak and the US dollar with it.
October was a big month for gold. The sharp sell-off at the end of September was forcibly rejected by week two of October and since then, gold hasn’t looked back.
The geopolitical flare up in Israel was undoubtedly a factor, but central bank activity may also have been a strong contributor. What we know for certain is that COMEX managed money futures positions reached another extended net short at the beginning of October, just over a year since the previous instance. That one helped produce a 25% gold price rally over the following six months. Net shorts positions have a habit of producing good subsequent returns for gold as we noted last August. On 10 October, a z-score reading of -2 was reached,1 and the subsequent short covering and long creations combined with an almost 10% rise in the US dollar price, suggest a good chance that history will repeat itself (Chart 2).
The other positive news for gold is that ETFs blinked in October. After months of steady outflows, a trickle of inflows appeared and flows look to have levelled off. In our February 2023 GMC we found that futures tend to lead ETFs even when accounting for reporting differences. These two sources of demand have been absent for much of this year, with central banks, Asian bar and coin buyers and some OTC investment taking the baton.
Chart 2: When net shorts are extended, gold tends to do well over the following six months*
Data as of 7 November, 2023 – *Data is weekly from 13 June 2006 to 24 October 2023. Positioning is calculated as the 52-week z-score of COMEX managed money net long positions. Original analysis here (Sources: Bloomberg, World Gold Council)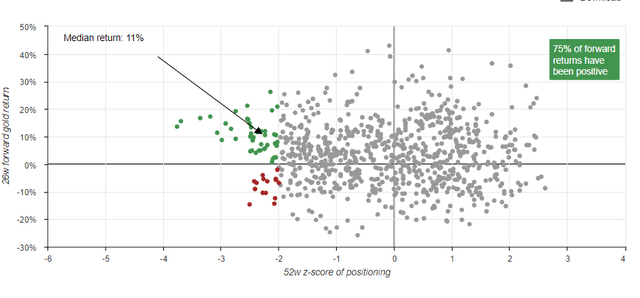
Chart 3: Gold prices have been calmly rangebound during three years of market upheaval*
*Weekly Open-High-Low-Close data for gold in US$/oz (XAU) from 4 January 2019 to 27 October 2023. (Sources: Bloomberg, World Gold Council)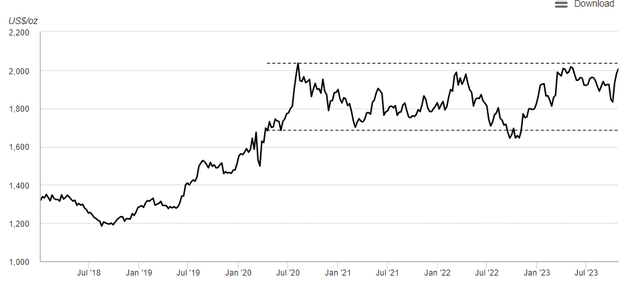
It is possible that with a full house of investment behind it, including ETFs and futures, gold could break out of the broad range in which it has traded since the middle of 2020 (Chart 3). But we believe one or more factors are required for this to occur.
Geopolitical environment stays volatile or gets worse: A continuation or escalation of the current elevated geopolitical tension is likely to dampen economic sentiment, disrupt supply chains and risk higher energy prices – likely driving developed market economies towards stagflation risks. The difference between this geopolitical tension and that of last year (the onset of the Ukraine war) is the likelihood that it compounds rather than replaces existing tensions.
Equities entering a bear market: Earnings projections remain quite rosy, but prices, particularly the Nasdaq, are rolling over. The index is down more than 10% already from its mid-year peak during what is supposedly the seasonally strongest period. A greater than 20% drop from the peak – a ‘bear market’ – could spur additional interest in gold from investors, concerned perhaps that equity dips are no longer worth buying. Recent bear markets have been kind to subsequent gold returns (Chart 4).
Chart 4: Gold tends to do well when equities enter a bear market*
* SPX index drawdowns in grey. Data from January 2000 to October 2023. Gold returns calculated from first date of 20% drawdown without a bounce. (Sources: Bloomberg, World Gold Council; Disclaimer)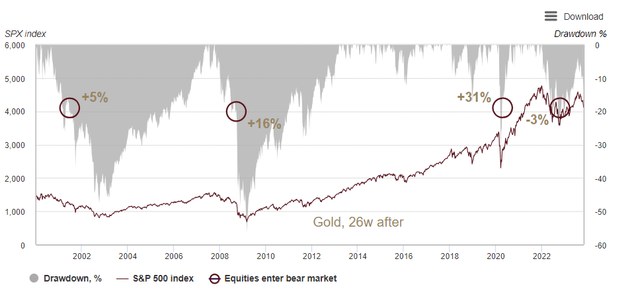
Bond yields probably need to peak, but it might not be plain sailing for gold when they come down. They are only likely to do so if inflation is perceived to be comfortably heading towards target. That would then make bonds attractive again from both a more compelling real return and a likely lower bond-equity correlation.
In summary…
Whether an uptrend through US$2,000/oz is established or not, the past two years have cemented not only gold’s ability to maintain its cool in a turbulent environment. It has shown that demand for gold can come from various uncorrelated sources and help prices defy over-simplified notions of what drives them. A break-out from the current range is likely to require a catalyst. We think one or more of the following are candidates: a geopolitical escalation, a peak in bond yields or an equity bear market. Until then, we think it likely that prices remain quite choppy, as we outlined in our last GMC.
Footnotes
-
A z-score of -2, indicating that an observation was two standard deviations below the mean, is commonly associated with an infrequent event.
Original Post
Editor’s Note: The summary bullets for this article were chosen by Seeking Alpha editors.
Read the full article here

