Stress Testing The Bullish Case
As outlined previously, the fundamentals and technicals continue to support the case for a demographically driven secular bull market in stocks that could last until 2034. One of the best ways to test the base case is to continually ask:
What Could Go Wrong Or What Could We Be Missing?
If you understand the global macroeconomic backdrop, a good place to start is an inflation and interest rate induced debt crisis.
Oracle
Debt Crisis Setup
In the wake of the 2008-2009 global financial crisis, central banks kept rates extremely low for years, which provided market participants, including governments, with a strong incentive to take on debt.
StockCharts.com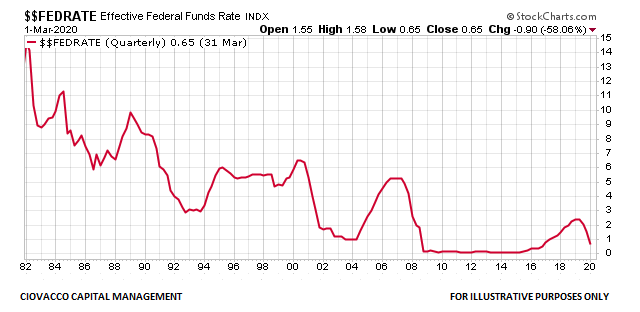
Since we are exploring a hypothetical ‘what could go wrong’ scenario, we will assume inflation remains higher than expected over the next two to three years. Higher inflation would most likely be met with additional Fed interest rate hikes and rates could remain elevated longer than market participants expect.
Balance Sheet Risk
Silicon Valley Bank provided an example of how rising interest rates can adversely impact asset prices, access to capital markets, and balance sheets. If rates remain elevated in an environment with balance sheet deterioration, it may be difficult to find sources of funding to roll over debt that is nearing maturity. The potential problems with refinancing in the commercial real estate sector are well documented. If refinancing problems increase, default rates will most likely follow, which in turn could lead to even tighter credit standards.
@WSJ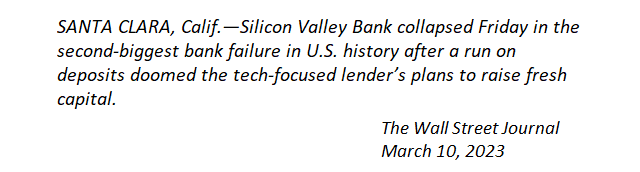
Tighter Credit Could Impact Economy
Hypothetically, a spike in bond default rates, paired with tighter credit standards, could adversely impact employment and consumer spending. Weaker consumer spending would impact economic output and corporate earnings. A reduction in corporate earnings could lead to layoffs, a recession, and a significant drop in the stock market. If a major debt crisis were just around the corner, we would expect the stock market’s profile to be highly vulnerable. Therefore, we can gain a better understanding of the market’s risk/reward profile by comparing August 2023 to highly vulnerable points in history that were followed by another significant leg down in the S&P 500 Index (SPX) and the SPDR S&P 500 ETF (NYSEARCA:SPY).
StockCharts.com / CCM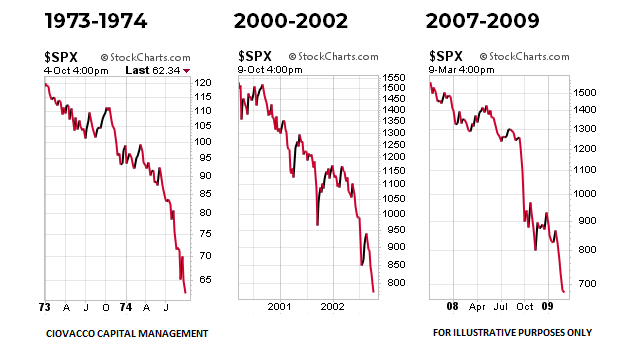
Secular Trend Strength
Given the base case in 2023 is the S&P 500 resumed a secular bullish trend in October 2022, it is prudent to have tools to monitor the health and sustainability of secular trends. Thus, we will use a working prototype of a secular trend scoring system based on 505 binary questions used to differentiate between secular bull markets and periods of secular stagnation. The scores range from 100% (very healthy secular trend) to 0% (looks nothing like a secular trend).
1969 Stock Market Plunge
In late 1968, the S&P 500 peaked, dropped for several months, and staged an impressive rally before stalling in Q4 1969. The bullish rally attempt failed, and the S&P 500 lost an additional 26.54% between November 21, 1969, and May 26, 1970. On November 21, 1969, the S&P 500 posted a secular trend score of 24.75%, which placed it on the higher end of the vulnerability scale.
StockCharts.com / CCM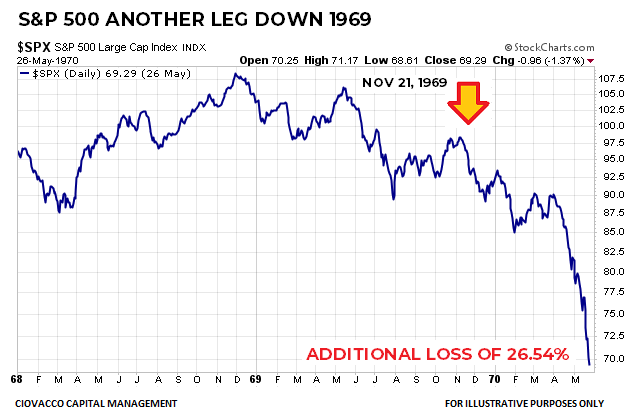
1974: Bear Market Round Two
With inflation as a primary bearish catalyst, the S&P 500 peaked in January 1973 kicking off a protracted and painful bear market. Buyers tried to make a stand in Q1 1974 near the 1971 lows but were unable to flip the market’s trend. Between March 27, 1974 and October 4, 1974 the S&P 500 lost an additional 35.52%. The market’s secular trend score on March 27 was an unimpressive 14.46%.
StockCharts.com / CCM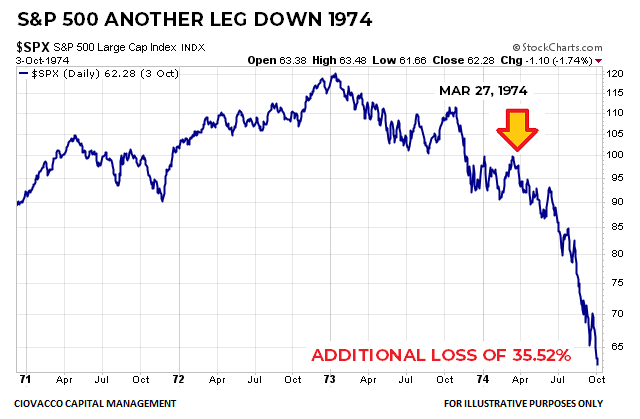
2001: Dot-Com Act II
A major bear market began in 2000 with the S&P 500 dropping into Q1 2001. A 2001 Q2 rally attempt ran out of gas and the bears regained control. Between June 13, 2001 and October 9, 2002 the S&P 500 lost an additional 37.44%. On June 13, 2001, the S&P 500 posted a weak secular trend score of 20.40%.
StockCharts.com / CCM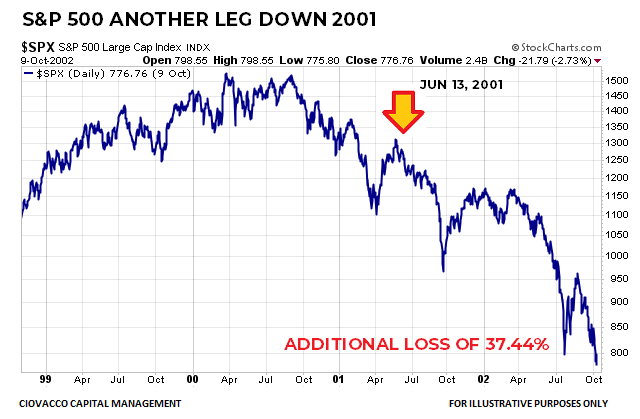
2008: The Final Financial Crisis Act
In the wake of a housing bubble, the S&P 500 peaked in October 2007. Buyers tried to regain control of the stock market in March 2008, but the rally fizzled in May. The market was extremely vulnerable on September 12, 2008 and could only muster a secular trend score of 10.10% (shares very little with a strong secular trend). The vulnerable profile was followed by another painful leg down with the S&P 500 dropping an additional 45.95% between September 12, 2008 and March 9, 2009.
StockCharts.com / CCM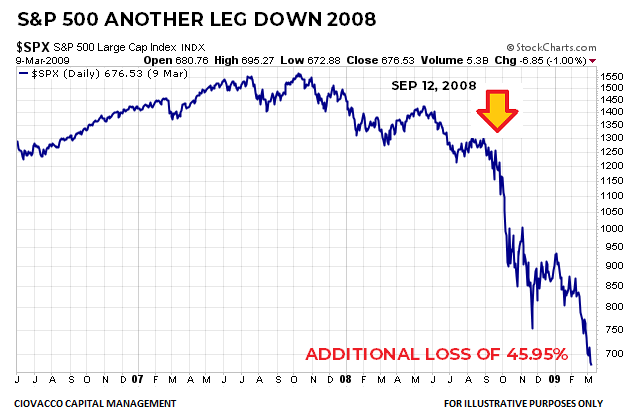
How Does 2023 Compare?
In the four cases above (1969, 1974, 2001, and 2008), the median outcome was an S&P 500 decline of 36.48% that occurred over the next 6.3 months. The median secular trend score before the decline was a concerning 17.43%, with the max score being 100% and the min being 0%. Therefore, in 2023 the closer the secular trend score is to 100%, the lower the odds of an imminent severe economic recession and debt crisis. Conversely, the closer the score is to 17.43%, the more concerned we would be about major economic and market dislocations occurring over the next six months. What was the S&P 500’s score on August 24,2023? The answer is a very secular trend like 86.04%, which speaks to market expectations regarding the probability of an imminent debt crisis and/or severe economic recession.
CCM Research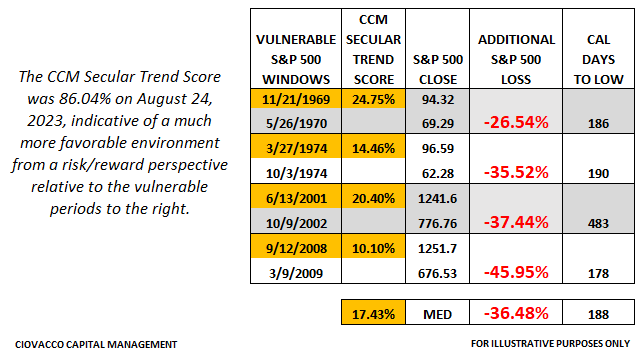
Jackson Hole Comparison
Last week’s Jackson Hole speech from Fed Chair Powell provides another opportunity to objectively assess concerns about inflation, interest rates, and Fed policy. A year ago, the S&P 500 was painfully weak following Powell’s August 26, 2022 Jackson Hole speech, primarily based on higher for longer fears. If we compare the S&P 500’s weekly trend following Jackson Hole in 2022 to post-Jackson Hole 2023, we see some significant differences. In 2022, the weekly trend was down with price below a declining 50-week moving average in green.
StockCharts.com / CCM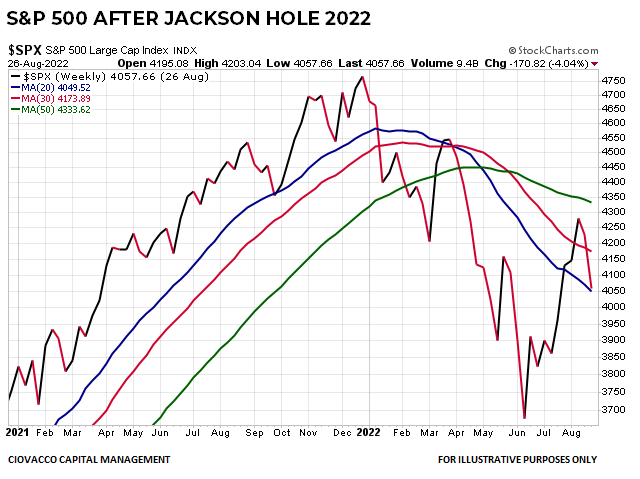
The market appears much more confident a year later, with a positive weekly trend and the S&P 500 above an upward-sloping 50-week moving average. Based on the data we have in hand, the market is not screaming “imminent debt crisis, severe recession, and massive drawdowns.”
StockCharts.com / CCM
The Charts In Front Of Us
Is it possible the 2023 weekly chart above reverses course in an abrupt manner and morphs into a downtrend in the coming weeks? Is it possible the secular trend score begins to plummet? The answers to both questions are yes, and both may happen very soon, but neither has happened yet. The bearish economic, debt, and market cases all need something to change. With the massive market interventions from central banks and policymakers following the global financial crisis and COVID pandemic, it is possible the current economic cycle has been skewed. Thus, we will continue to take it day by day with an open mind about a wide range of outcomes from wildly bullish to wildly bearish.
Are Credit Spreads Waving Crisis Flags?
If the economy were on the verge of a severe recession, corporate earnings were about to get hit hard, and bond defaults were on the cusp of a major spike, we would expect to see credit spreads widening significantly as they did during the global financial crisis. Again, that may happen very soon, but it has not happened yet. At the moment, credit spreads look tame relative to 2008, 2011, 2016, and 2020.
Federal Reserve Bank of St. Louis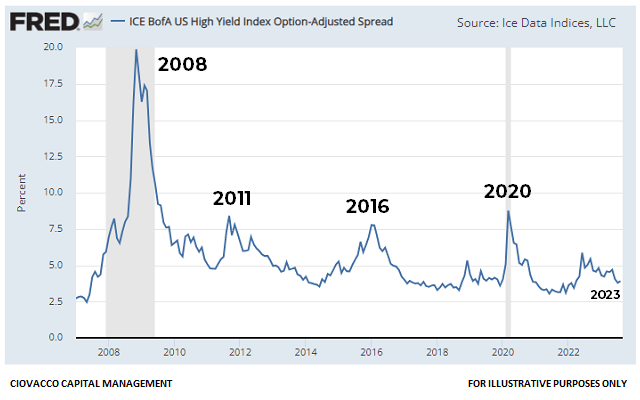
Moral Of The Story
The text below comes from a recent research note from Sentiment Trader’s Jason Goepfert:
After months of extreme and protracted optimism from Dumb Money and caution from Smart Money, the script is about to flip. When the spread between them turns positive after months, and after extreme readings, stocks have had a strong tendency to rise, as it has been a bull market phenomenon.
The fundamentals and technicals continue to support the resumption of a demographically driven secular bull market that could last until 2034, which is reflected in our current investment stance.
Read the full article here

