
Introduction
This article continues my ongoing MDA breakout research based upon inductive parametric statistics using over 75 variables from across different fields of finance. The model builds on fundamental, sentiment, behavioral, and technical variables using multiple-discriminant analysis [MDA] to forecast changes in price based on the highest predictive variable combinations. Investors who would like to examine this methodology in more detail can watch my SA webinar on the Momentum Breakout model.
Breakout Conditions
Long-time readers of my articles know that I strongly emphasize the value of trading in the most optimal conditions possible and avoiding weak and dangerous trading conditions. In the simplest terms, this means:
- Buy stocks with the strongest MDA Breakout conditions and variables.
- Buy when the Sector for that stock is positive and improving on the gauges.
- Buy when broad Market conditions also have strong positive momentum.
The more of these conditions that are aligned, the stronger the bid up in price that you’re likely to experience in your investments. Sometimes you can do very well in an excellent stock that’s in a declining sector while the markets are weakening, but that’s more challenging and often the gains do not sustain as long.
The Healthcare Breakout Illustrated
You can start in any order you prefer as you evaluate the condition of your stock, sector, and market condition. Years of documented research shows that the alignment of all three conditions will greatly enhance your returns and extend the duration of your gains.
Pyxis Oncology (PYXS)
Pyxis is a small-cap biotech stock that was one of four weekly MDA breakout selections that generated strong gains for the MDA picks earlier this year in the November 2023 positive signal. Pyxis is up +20.8% for July. Last year, Pyxis gained over 320% in the last most positive momentum condition in the November breakout signal.
These numerous breakout variables are combined into scores that measure the strength of momentum throughout the day in 15-minute increments on the daily chart below.
app.vmbreakouts.com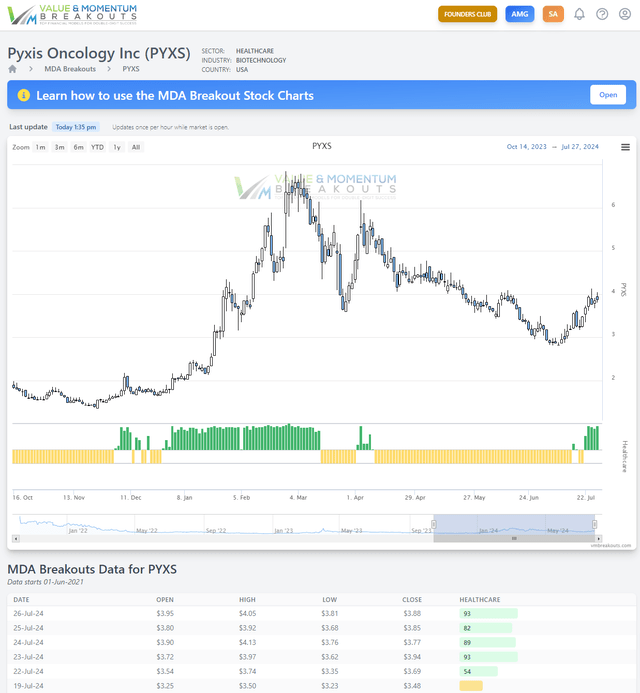
Not only is Pyxis Oncology one of many strong biotech breakout stocks I’m highlighting, it’s continuing to deliver gains with supportive momentum from both the sector and the market. The last time the small-cap momentum signals were this highly positive was back in November 2023 in anticipation of a Fed rate cut in January that never did materialize.
Examining the Healthcare Sector
First, the Healthcare momentum conditions show the strong positive breakout conditions since last year, beginning 3 weeks ago on the sector gauges. The larger the number of basic material stocks that move into positive conditions on my MDA scale, the stronger the signal. You can see on the green line that this signal is one of the largest positive moves since last year, when it stayed positive for 20 consecutive weeks.
app.vmbreakouts.com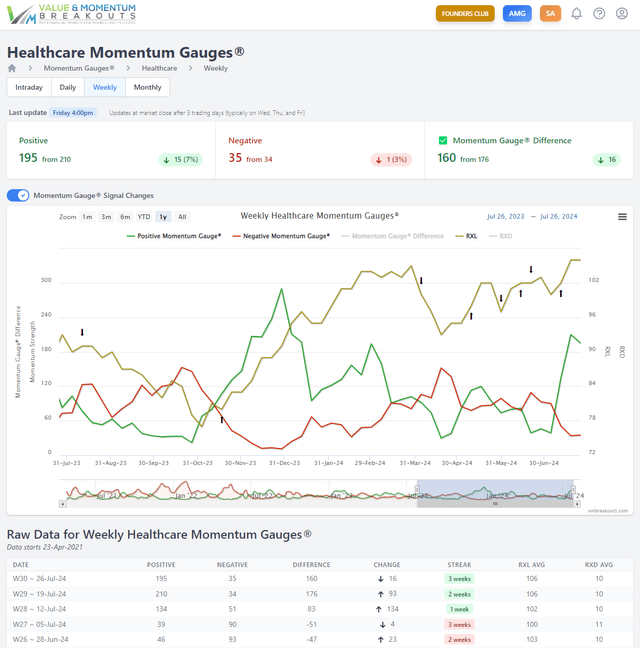
While this recent and near vertical momentum breakout move on the gauges has been highly positive for the small-cap Biotechs, you can see that many of the large/mega cap drug companies like Lilly (LLY) have sold off.
FinViz.com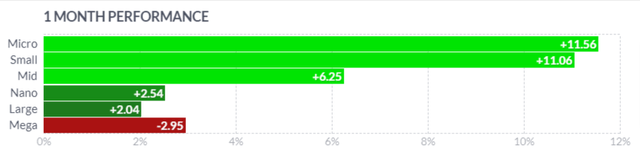
It is important to see where the money flows are going on the signals and how the record skew into mega caps is now unwinding into strong flows for the small caps. As I alerted readers on the July 8th Momentum Gauge signals:
- Record Market Skew Leads To Broadest Stock Breakout Since November
- The July 2024 MG Breakout: Primer On Bullish Stair Steps | Seeking Alpha Investing Groups
FinViz.com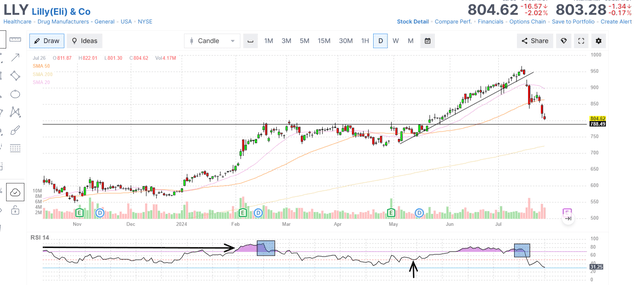
Second, in the next step, we can examine the technical price charts of the biotech segment within the healthcare sector to see what indicators there may be showing a strong move. Also, many technical traders use these price charts to try to forecast price targets independent of fundamental variables. I support nearly all approaches to validating market conditions. While the data may be more limited, the patterns can have a powerful impact on trader sentiment, converging at significant resistance or support levels as I will show next.
The daily chart of the Biotech bull fund, Direxion Daily S&P Biotech Bull 3X Shares ETF (LABU), shown below, gives a clear illustration of bullish stair step patterns moving higher along a positive channel from February. You can revisit that first breakout signal again on the Basic Material momentum gauge chart above.
FinViz.com VMBreakouts.com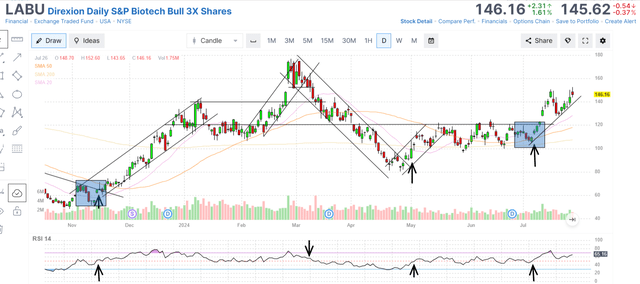
Expanding to the weekly chart back to 2022, you can see how biotechs are moving in a positive channel from November lows in an early breakout for July. The long-term view suggests a move to $175/share as the price clears key resistance above $145/share. Again, the moves are currently strongest among the small caps, just as they were in the prior largest breakout signal in mid-November 2023.
FinViz.com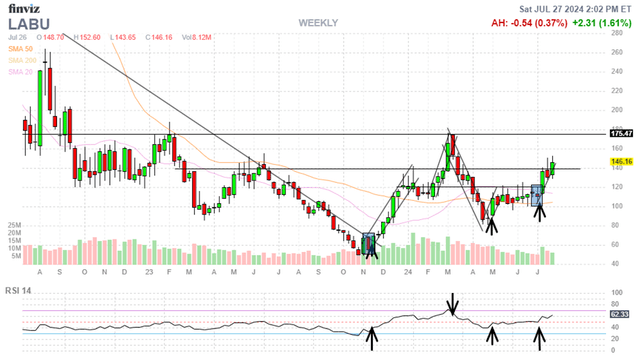
Examining our Weekly Momentum Gauge signal returns on our tracker of leveraged funds, we can see an important trend change and similarities back to the November 2023 returns. Unlike prior breakout signals in May and January, the July returns are being led by small-cap funds. The last time we saw the small-cap funds lead was in November with the strongest gains in LABU +78.8%, Direxion Daily Homebuilders & Supplies Bull 3X Shares (NAIL) +69.5%, and other small-cap segments of the financial sector.
VMBreakouts.com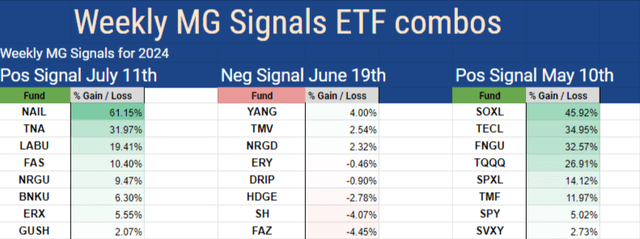
VMBreakouts.com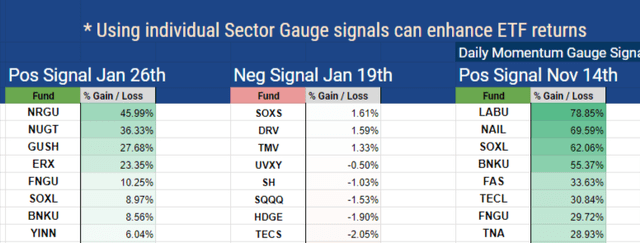
As I share frequently in our member chat rooms and social media, you can see the record moves into the small caps that could accelerate in the coming weeks. I believe this acceleration just like last November is largely driven on the anticipation of the first cut in Fed rates after 11 rate hikes that has been especially detrimental to the performance of small-cap stocks.
X.com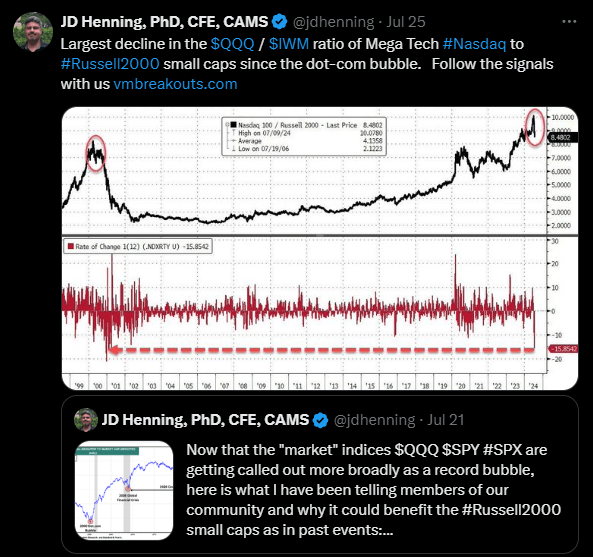
Examining the Market Conditions
Lastly, I like to examine the market conditions to understand which way the broad fund flows are moving. Buying good stocks while the market outflows are large means it’s much harder for even good stocks to get a bid or sustain positive gains. Currently, we’re in the largest market skew since the Global Financial Crisis and I have detailed these extremely unusual conditions in a recent market article below:
- Record Market Skew Leads To Broadest Stock Breakout Since November
Yardeni.com VMBreakouts.com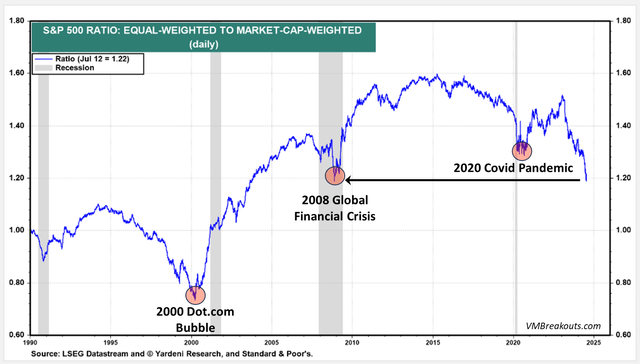
Conclusion
The market, the sector, and the stock signal for Pyxis Oncology are all extremely positive through the writing of this article. BUT, the momentum is clearly moving toward small caps and away from Mega cap giants like Lilly in the same market sector this month. Also, Q2 earnings results will be key as we await more corporate results and guidance.
The Daily Market Momentum Gauges broke out in a positive signal on July 8 and have entered the most positive weekly signal since January 2021. This means that the largest number of stocks are surpassing the November breakout conditions detailed in my Q3 outlook article above. It also means we are finding breakout stocks in many more sectors, and especially among the small-cap stocks.
app.vmbreakouts.com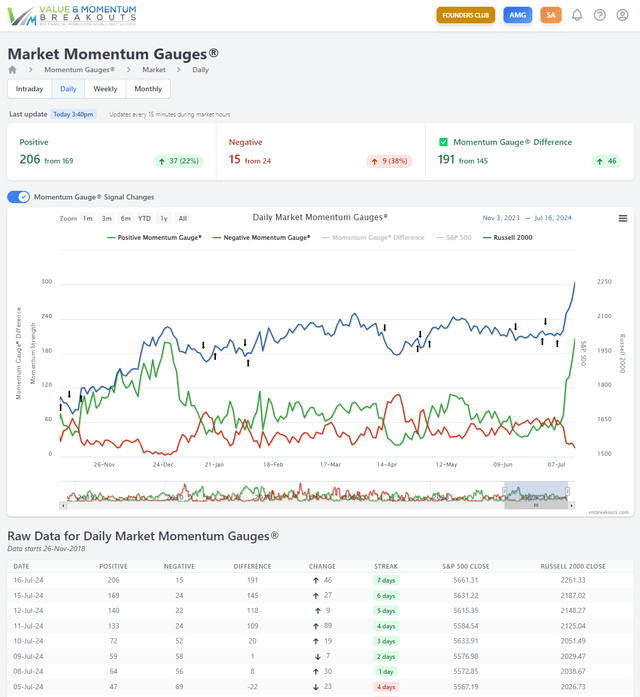
The real question now will be, how long will this last, and how does it resemble the same patterns and gains as all the prior large breakout moves?
I hope you benefit greatly, and I wish you the very best in all your trading decisions.
JD Henning, PhD
Read the full article here

