Foreword
This article is based on YCharts Y-Ratings. The Y-Rating is a summary score that takes into account 3 key indicators: Value Score, Fundamental Score, and Valuation from Historical Multiples.
In a glance, it gives a sense of both the value and the current strength of a stock.
The Y-Rating
Importance: High.
Historical Predictive Power: Moderate.
How it relates to returns: See individual components – Value Score, Fundamental Score, and Valuation from Historical Multiples.
What it is: A single summary score that takes into account our 3 key indicators: Value Score, Fundamental Score, and Valuation from Historical Multiples.
How to use it: In a glance, gives you a sense of the safety and return possibility of the stock.
Watch out for: It will often miss stocks with a huge potential for gains because big gains are correlated with high risk. Also, it sometimes misses the decline of industries which were profitable for long periods of time.
Detailed Calculation: Once the three scores of Value, Fundamentals, and the Historical Multiples are known, YCharts calculates a final score.
To receive an overall “Attractive” rating, a stock must:
- Receive a Value Score of 9 or 10
- Receive a Fundamental Score of 7 or higher
- Have a Historical Value greater than its current price.
To receive an overall “Avoid” rating, a stock only needs to have “Weak” fundamentals – a Fundamental Score of 4 or lower.
YCharts rates all other companies “Neutral,” since based on their testing there is no strong quantitatively-backed reason to believe they will underperform or outperform the market significantly as part of a portfolio.
—YCharts.
Combine the top rating of “attractive” with annual dividend yields over 5% and your get this list of July divvy nifty 60 stocks of which 58 measure up to delivering dividend payouts for $1k invested greater than the single share price of the stock.
The July Divvy Nifty-60
(Alphabetically by Ticker Symbol)
Source: YCharts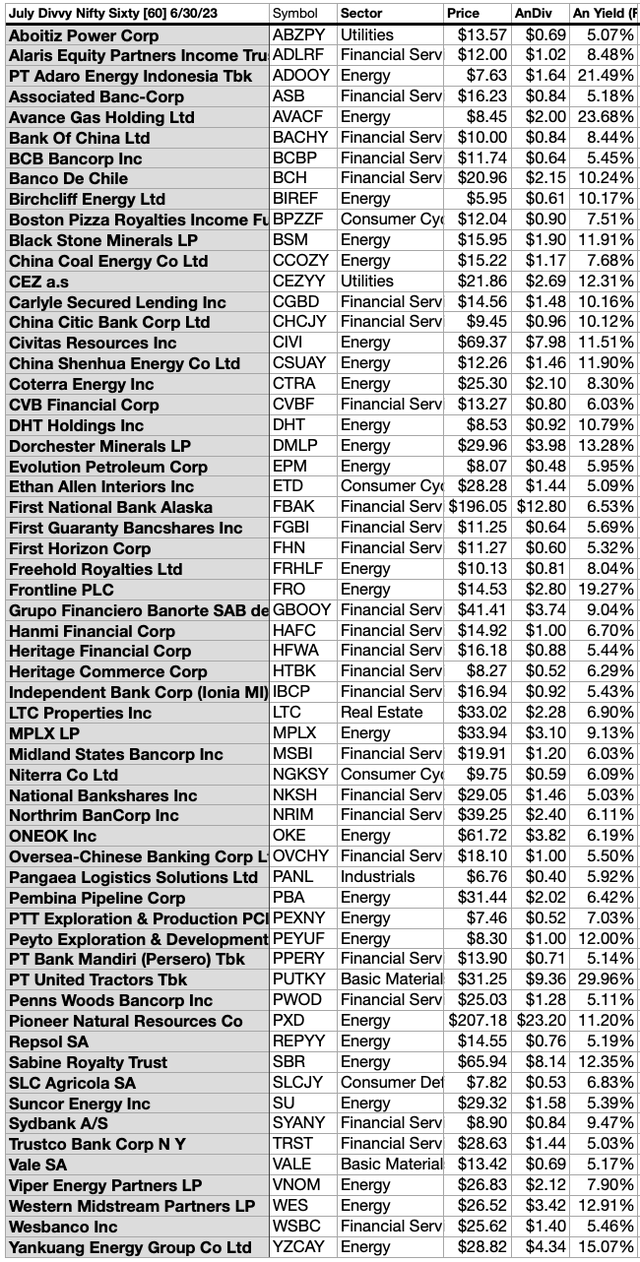
Any collection of stocks is more clearly understood when subjected to yield-based (dog catcher) analysis, this collection of July Divvy Nifty 60 stocks is perfect for the dogcatcher process. Below are the June 30, 2023 data for 60 dividend stocks parsed by YCharts.
The prices of 58 of these June 60 stocks (listed by yield) made the possibility of owning productive dividend shares from this collection more viable for first-time investors.
All fifty-eight live-up to the ideal of having their annual dividends (from a $1K investment) exceed their single share prices. Many investors see this condition as “look closer to maybe buy” opportunity.
Which of the 58 are ‘safer’ dividend dogs? To find the answer find my “Safer” Dividend Dogcatcher follow-up article about these July divvy nifty 60 in the Seeking Alpha Investing Groups tab on or about July 10. To get there, simply click on the link in the last bullet point at the top of this article.
Actionable Conclusions (1-10): Analysts Estimated 26.67% To 54.49% Net Gains For Top Ten July Divvy Nifty-60
Three of ten top divvy nifty 60 stocks by yield were also among the top ten gainers for the coming year based on analyst 1-year target prices. (They are tinted gray in the chart below.) Thus, the yield-based forecast for these July dogs, as graded by Wall St. Wizards, was 30% accurate.
Source: YCharts.com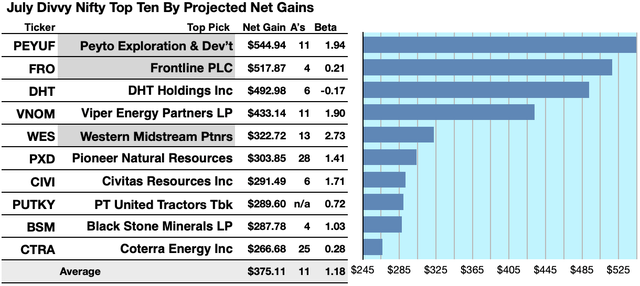
Estimated dividends from $1000 invested in each of the highest-yielding nifty 60 stocks, added to the median of aggregate one-year target prices from analysts (as reported by YCharts), generated the following results. (Note: one-year target prices by lone analysts were not included.) Ten probable profit-generating trades projected to July 2024 were:
Peyto Exploration & Development (OTCPK:PEYUF) was projected to net $544.94, based on the median of target estimates from 11 analysts, plus dividends, less broker fees. The Beta number showed this estimate subject to risk/volatility 94% greater than the market as a whole.
Frontline plc (FRO) was projected to net $517.87 based on the median of target price estimates from 4 analysts, plus annual dividend, less broker fees. The Beta number showed this estimate subject to risk/volatility 79% less than the market as a whole.
DHT Holdings Inc (DHT) was projected to net $492.98, based on dividends, plus the median of target price estimates from 6 analysts, less broker fees. The Beta number showed this estimate subject to risk/volatility 17% opposite the market as a whole.
Viper Energy Partners LP (VNOM) was projected to net $433.14 based on the median of target price estimates from 11 analysts, plus annual dividend, less broker fees. The Beta number showed this estimate subject to risk/volatility 90% greater than the market as a whole.
Western Midstream Partners (WES) was projected to net $322.72, based on dividends, plus the median of target price estimates from 13 analysts, less broker fees. The Beta number showed this estimate subject to risk/volatility 173% greater than the market as a whole.
Pioneer Natural Resources Co (PXD) was projected to net $303.85, based on dividends, plus the median of target price estimates from 28 analysts, less broker fees. The Beta number showed this estimate subject to risk/volatility 41% greater than the market as a whole.
Civitas Resources Inc (CIVI) was projected to net $291.49, based on dividends, plus the median of target price estimates from 6 analysts, less broker fees. The Beta number showed this estimate subject to risk/volatility 71% greater than the market as a whole.
PT United Tractors Tbk (OTCPK:PUTKY) was projected to net $289.60, based on dividends, less broker fees. The Beta number showed this estimate subject to risk/volatility 28% under the market as a whole.
Black Stone Minerals LP (BSM) was projected to net $287.78, based on dividends, plus the median of target price estimates from 4 analysts, less broker fees. The Beta number showed this estimate subject to risk/volatility 3% over the market as a whole.
Coterra Energy Inc (CTRA) was projected to net $266.68, based on the median of estimates from 25 analysts, plus dividends, less broker fees. The Beta number showed this estimate subject to risk/volatility 72% less than the market as a whole.
The average net gain in dividend and price was estimated at 37.51% on $10k invested as $1k in each of these ten stocks. These gain estimates were subject to average risk/volatility 18% over the market as a whole.
Source: Open source dog art from dividenddogcatcher.com
The Dividend Dogs Rule
Stocks earned the “dog” moniker by exhibiting three traits: (1) paying reliable, repeating dividends, (2) their prices fell to where (3) yield (dividend/price) grew higher than their peers. Thus, the highest yielding stocks in any collection became known as “dogs.” More precisely, these are, in fact, best called, “underdogs.”
37 July Divvy Nifty 60 Stocks Per Analyst Targets
Source: YCharts.com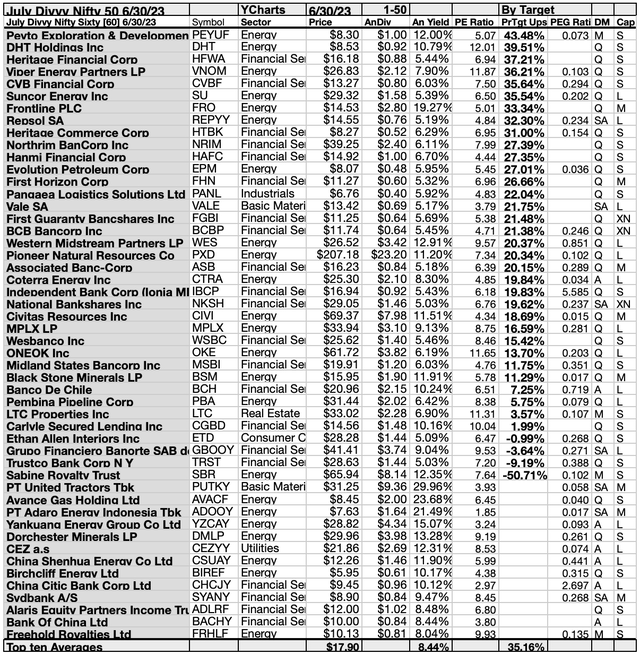
50 July Divvy Nifty 60 Stocks By Yield
Source: YCharts.com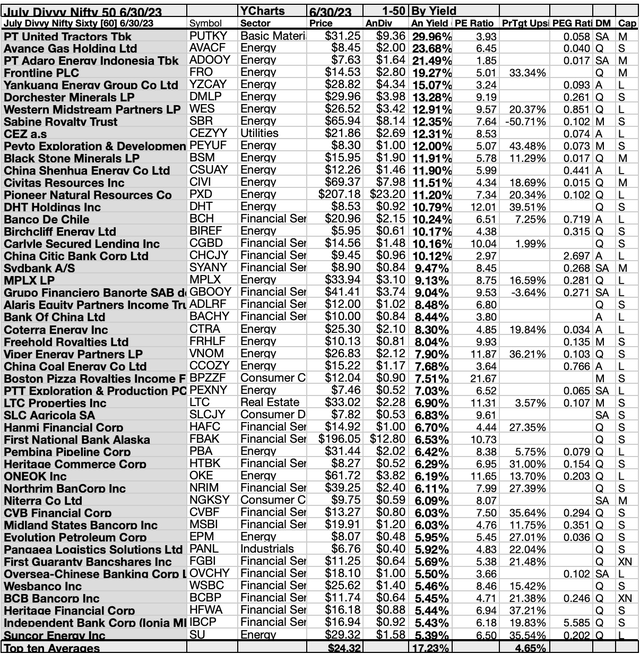
Actionable Conclusions (11-20): Ten Top July Divvy Nifty 60 By Yield
Top ten July Divvy Nifty 60 stocks by yield represented just three of eleven Morningstar sectors. The first place was held by the lone basic materials member, PT United Tractors Tbk [1].
Then eight slots (from 2 to 8 & 10) were filled by energy sector representatives, Avance Gas Holding Ltd (OTCPK:AVACF) [2]; PT Adaro Energy Indonesia Tbk (OTCPK:ADOOY) [3]; Frontline PLC (4); Yankuang Energy Group Co Ltd (OTCQX:YZCAY) [5]; Dorchester Minerals LP (DMLP) [6]; Western Midstream Partners LP [7]; Sabine Royalty Trust (SBR) [8]; Peyto Exploration & Development Corp [10].
To complete the top ten of the July Divvy Nifty 60 pack, the lone utilities representative placed ninth, CEZ a.s. (OTCPK:CEZYY) [9].
Actionable Conclusions: (21-30) Ten Top July Divvy Nifty 60 Stocks Showed 16.68%-43.49% Upsides While (31) No Downsides Fell Per Analyst Estimates to 2024
Source: YCharts.com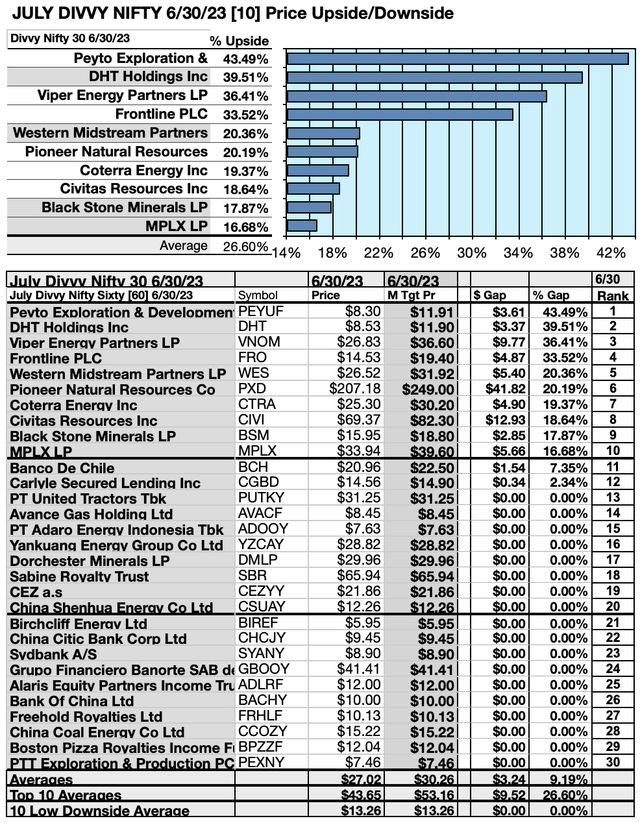
To quantify top-dog rankings, analyst median price target estimates provided a “market sentiment” gauge of upside potential. Added to the simple high-yield metrics, the median of analysts target price estimates, became another tool to dig out bargains.
Analysts Forecast A 17.92% Advantage For 5 Highest Yield, Lowest Priced, of 10 Divvy Nifty 60 Stocks To June 30, 2024
Ten-top July divvy nifty 60 stocks were culled by yield for this update. Yield (dividend / price) results provided by YCharts did the ranking.
Source: YCharts.com
As noted above, ten-top July divvy nifty 60 stocks screened 6/30/23, showing the highest dividend yields, represented three of eleven in the Morningstar sector scheme.
Actionable Conclusions: Analysts Predicted 5 Lowest-Priced Of The Top-Ten Highest-Yield July Nifty 60 Dividend Stocks (32) Delivering 30.62% Vs. (33) 25.97% Net Gains by All Ten Come 2024
Source: YCharts.com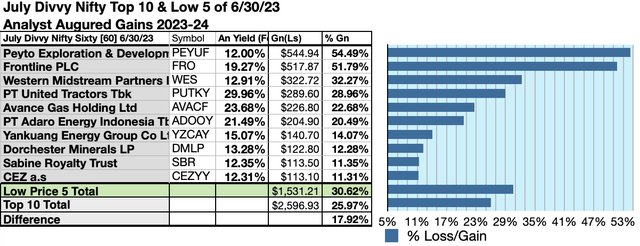
$5000 invested as $1k in each of the five lowest-priced stocks in the top ten July divvy nifty 60 kennel by yield were predicted by analyst 1-year targets to deliver 17.92% more gain than $5,000 invested as $.5k in all ten. The second lowest-priced selection, Peyto Exploration & Development Corp showed the best analyst-estimated net gain of 54.49%.
Source: YCharts.com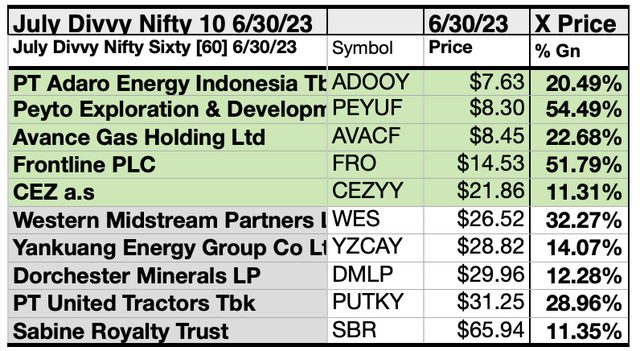
The five lowest-priced top-yield divvy nifty 60 Dogs as of June 30 were: PT Adaro Energy Indonesia Tbk; Peyto Exploration & Development Corp; Avance Gas holding Ltd; Frontline PLC; and CEZ a.s., with prices ranging from $7.63 to $21.86.
Five higher-priced divvy nifty 50 dogs as of June 1 were: Western Midstream Partners LP; Yankuang Energy Group Co Ltd; Dorchester Minerals LP; PT United Tractors Tbk; Sabine Royalty Trust, whose prices ranged from $26.52 to $65.94.
The distinction between five low-priced dividend dogs and the general field of ten reflected Michael B. O’Higgins’ “basic method” for beating the Dow. The scale of projected gains based on analyst targets added a unique element of “market sentiment” gauging upside potential. It provided a here-and-now equivalent of waiting a year to find out what might happen in the market. Caution is advised, since analysts are historically only 15% to 85% accurate on the direction of change and just 0% to 15% accurate on the degree of change.
The net gain/loss estimates above did not factor in any foreign or domestic tax problems resulting from distributions. Consult your tax advisor regarding the source and consequences of “dividends” from any investment.
Afterword
July Divvy Nifty 58 Ideal Stocks by Yield
Source: YCharts.com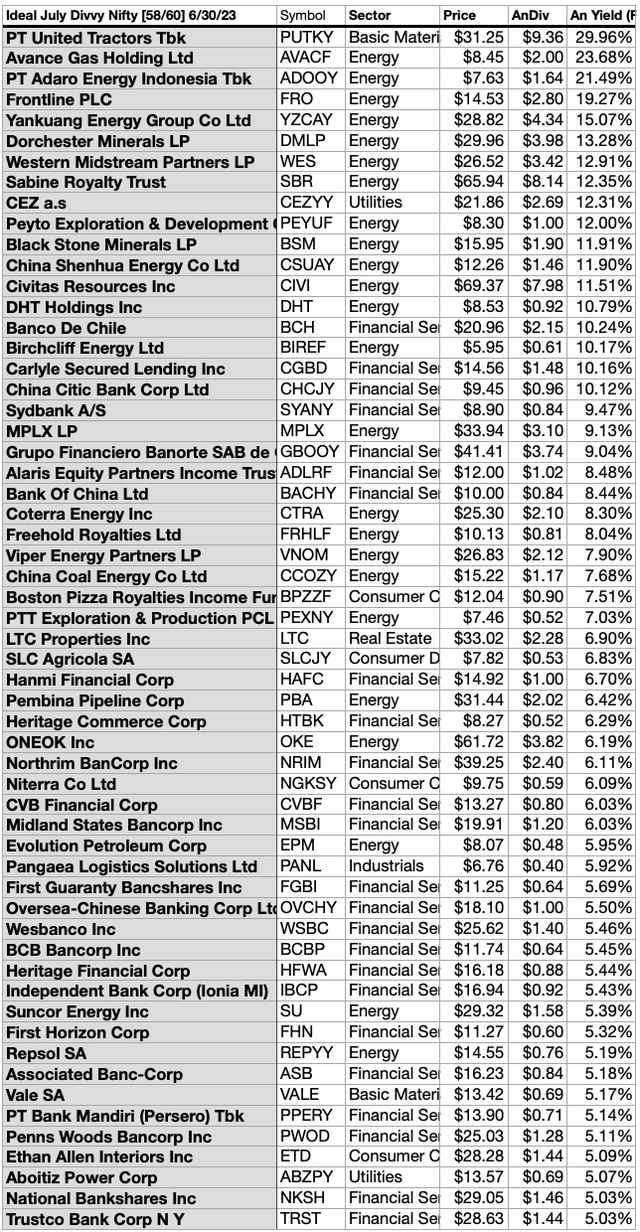
All 58 live-up to the ideal of having their annual dividends from a $1K investment exceed their single share prices. Many investors see this condition as “look closer to maybe buy” opportunity.
Which of the 58 are “safer” dividend dogs? To find the answer find my ‘Safer’ July Dividend Dogcatcher follow-up market piece for these May Divvy Nifty 51 Stocks from 2023 in the Seeking Alpha Investing Group Service appearing on or about July 10.
See How Far Ten Top July Divvy Nifty 60 Stocks Must Jump To Cease Being Fair Priced Dogs
Source: YCharts.com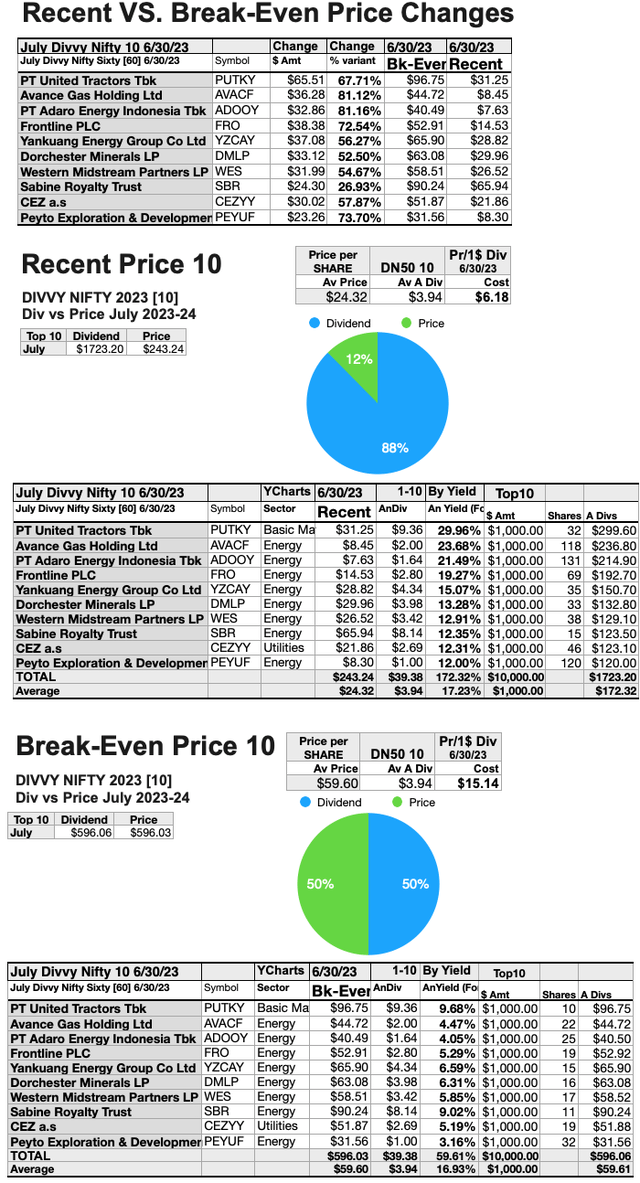
Since all top ten divvy nifty 50 shares are now priced less than the annual dividends paid out from a $1K investment, the dollar and percentage difference between the recent and break-even pricing are shown in the top chart above. Recent prices are detailed in the middle chart; with the break-even pricing of all ten top dogs showing in the bottom chart.
It would take upside market pressure to 81.16%, for all ten highest-yield June divvy nifty 60 stocks, to become break-even with their annual yield (from $1K invested) no longer meeting or exceeding their single share prices. These dogs have plenty of room to run.
Stocks listed above were suggested only as possible reference points for your purchase or sale research process. These were not recommendations.
Editor’s Note: This article discusses one or more securities that do not trade on a major U.S. exchange. Please be aware of the risks associated with these stocks.
Read the full article here


