
I placed a hold rating on Lennox International (NYSE:LII) stock in April, citing high inventory costs and revenue headwinds. Since then, the stock has returned 63% compared to the S&P 500 Index (SP500) return of 10%. The company has indeed improved its profitability over the past two quarters. Its free cash flow has also grown over the last quarter. But, revenue growth, as predicted, has fallen to low-single-digits. Besides that, the increase in the share price has reduced the free cash flow yield, although the company saw a 90% y/y increase in free cash flow in its June quarter. If the stock looked expensive in April, its valuation multiple has only increased since then. As a long-term investor, I refuse to chase this rally. I reiterate my hold rating on the stock. However, investors holding the stock may consider taking some profits but not selling their entire holdings.
The company is operating in a low-growth mode
The company grew its quarterly revenue by 3.5% and 3.3% in the March and June quarters (Exhibit 1). The company is coming off of a strong 2022, and the y/y comparisons look poor in that light. But, irrespective of year, the future growth rate may come in the mid-single-digit. The company expanded its gross margins above its quarterly average of 28.68% since June 2020 (Exhibit 1). The operating margin saw a big jump in June 2023 to 19.2%, 480 basis points above its quarterly average of 14.4%. The company has expanded its free cash flow, but the stock price jump has caused the free cash flow yield to plummet to 2.3% (Exhibit 2). If the price stayed close to $232, which was the price in April, the stock would have a free cash flow yield well above 3.3%.
Exhibit 1:
Lennox International Quarterly Revenue, Gross, Operating Margins (Seeking Alpha, Author Compilation)
Exhibit 2:
Lennox International Annual Free Cash Flow (Seeking Alpha, Author Compilation)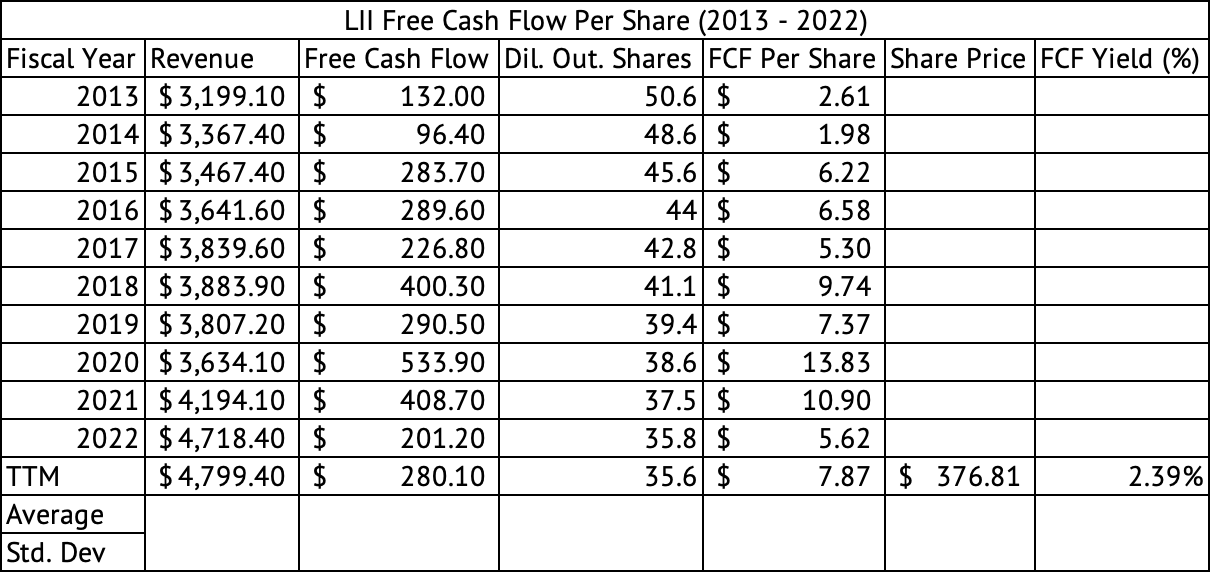
Inventory costs have increased
The company is carrying high levels of inventory. At the end of the June quarter, the company carried $856 million in inventory compared to the $753 million at the end of 2022 (Exhibit 3). This amounts to 91 days of sales in inventory, compared to its average of 66 days over the past decade. However, the company carried $904 million in inventory in March, so the June level improved from the prior quarter. There may be a seasonality factor embedded in this inventory level. The increased inventory was the primary cause for the drop in operating cash during the March quarter; the company used cash in its operations. One could speculate that there is a negative correlation between the current inventory levels and the stock’s performance in the subsequent quarters. This hypothesis will be proven or disproven in the coming quarters.
Exhibit 3:
Lennox International Annual Inventory Costs (Seeking Alpha, Author Compilation)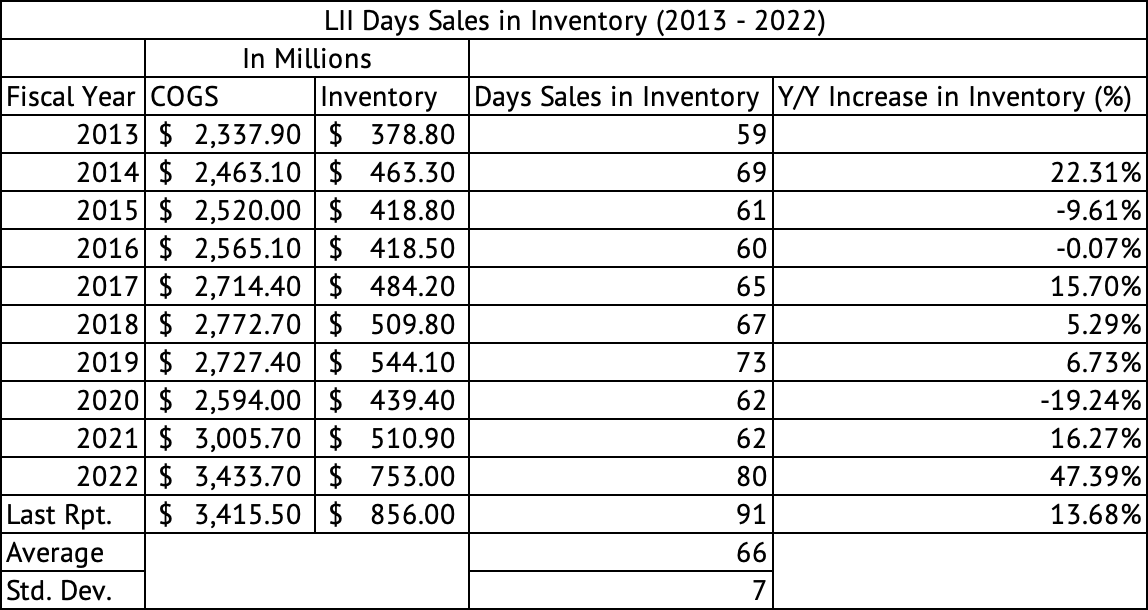
The U.S. is seeing a slowdown in job growth. Wall Street’s much coveted soft-landing may be here with the economy continuing to add jobs, albeit slower. The average job growth came in at 150,000 over the past three months. This Goldilocks economy needs to continue for Lennox to continue selling its products. There are already signs that the heat pump market is amid a slowdown. If the job market deteriorates appreciably, consumers may put off replacing the old air conditioners and lean more toward repairs.
Dividends, share buybacks, and debt
The increase in the stock price has reduced the yield. The stock yields 1.1% with a safe payout of 27%. The Vanguard S&P 500 Index ETF (VOO) offers 1.5%, and the Vanguard Industrials Index ETF (VIS) offers 1.3%, higher than Lennox’s. The US 3-month bill (US3M) yields 5.4%.
The company’s total debt has increased slightly since December 2022 (Exhibit 4). It now carries $1.53 billion compared to $1.48 billion in debt in December 2022. The company’s debt/EBITDA ratio is a manageable 1.9x. The company pays about $150 million in dividends annually, a sustainable sum given its cash flows and debt levels.
Exhibit 4:
Lennox International Debt (Seeking Alpha, Author Compilation)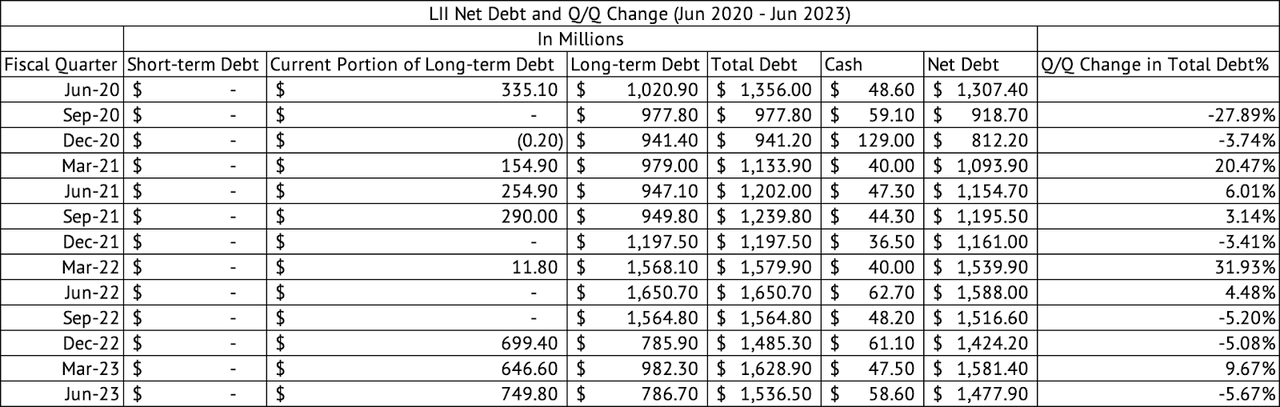
The company has spent $946 million in share buybacks since June 2020, reducing the share count from 38.4 million to $35.6 million (Exhibit 5). The share count is reduced by 2.8 million for an effective average share price of $337. When business was strong in 2021 and 2022, the company made hundreds of millions of dollars in share repurchases. Those repurchases have slowed down in the past few quarters. The lack of share repurchases may become another headwind for the stock in the coming quarters. The low dividend and lack of share repurchases may be another reason to avoid the stock at its current valuation.
Exhibit 5:
Lennox International Share Repurchase, Shares Issued (Seeking Alpha, Author Compilation)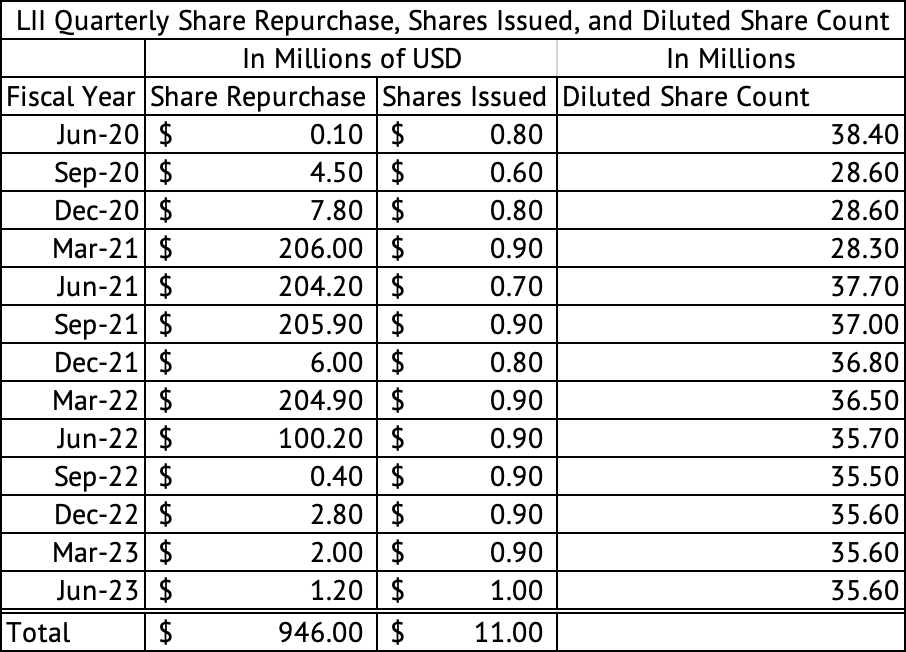
Overvalued
Lennox International and Carrier Global (CARR) look very expensive. Lennox is trading at a forward GAAP PE of 23x, while Carrier is trading at 28x—the companies in the Vanguard Industrials ETF trade at an average PE of 20x. Carrier Global sells at a 20x trailing and 14x forward EV/EBITDA multiple. Lennox International trades at 19x trailing and 17x forward EV/EBITDA multiple.
A discounted cash flow model, which assumes a 4% growth rate, 8.9% free cash flow margin, its quarterly average since June 2020, and a discount rate of 8%, puts the per-share equity value at $261 (Exhibit 6). Even if the discount rate were 7%, the per-share value would be $360. The stock trades at $382. I did not see the margin improvement coming at Lennox International that led to this incredible performance. But, there are no structural changes in the business, which would make these margins sticky. Besides, the company’s growth rate is down to low-single-digits even in these boom times. What would happen to its revenue growth if a recession or prolonged slowdown hits the economy? Over the years, I have learned to control my emotions in making investing decisions. The fear of missing out [FOMO] response to investing can lead to heavy losses. So, it is not worth chasing this stock at these valuations.
Exhibit 6:
Lennox International Discounted Cash Flow Model (Seeking Alpha, Author Compilation)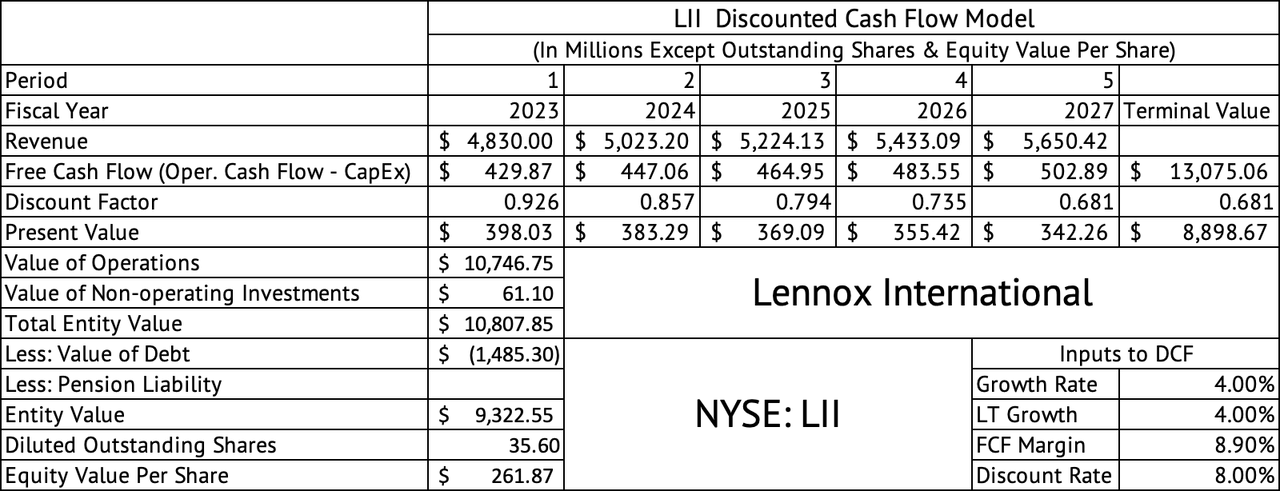
The industrial sector has benefited from massive spending by the U.S. Federal Government and governments globally. Russia’s invasion of Ukraine and the ongoing tensions between China and many other countries are making government policymakers in North America, Europe, and Asia rethink critical supply chains. This rethink of supply chains has spurred “friend-shoring” efforts where countries with good relationships support each other by setting up manufacturing plants for critical components.
Lennox International is an excellent company valued well above its long-term intrinsic valuation. Long-term investors may be better off waiting for a much lower valuation. The low dividend yield is another reason to avoid the stock. Current investors may consider taking some profits after this impressive run this year.
Read the full article here

