
Part I – Introduction
Texas-based energy explorer Marathon Oil Corporation (NYSE: NYSE:MRO) released its second-quarter 2023 results on August 2, 2023.
Note: This article updates my June 6, 2023 article. I have followed MRO on Seeking Alpha since Dec. 2020.
The company owns a multi-basin portfolio in the USA. Furthermore, MRO is also producing oil from Equatorial Guinea, West Africa.
The company expects a significant financial uplift in Equatorial Guinea in 2024 from increasing global LNG exposure due to legacy Henry Hub contracts expiration.
Note: MRO owns a 63% operated working interest under a production sharing contract in the Alba field and an 80% operated working interest in Block D. Also, MRO owns a 52% interest in Alba Plant LLC, accounted for as an equity method investment, which uses an onshore LPG processing plant located on Bioko Island.
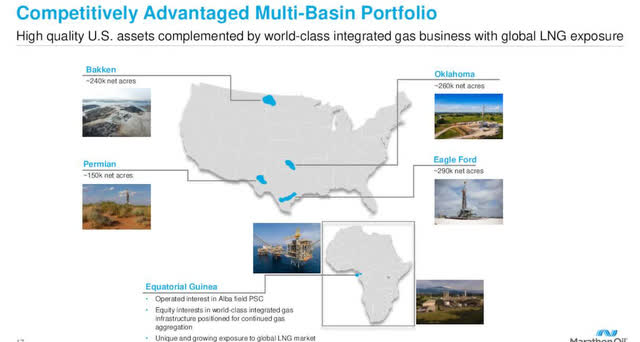
MRO Assets Map 2Q23 (MRO Presentation)
1 – 2Q23 Results Snapshot
Marathon Oil Corporation reported a second-quarter 2023 adjusted net income per share of $0.48, which beat analysts’ expectations compared to $1.32 a year ago. The decrease was due to weaker oil realizations and higher production costs in the USA.
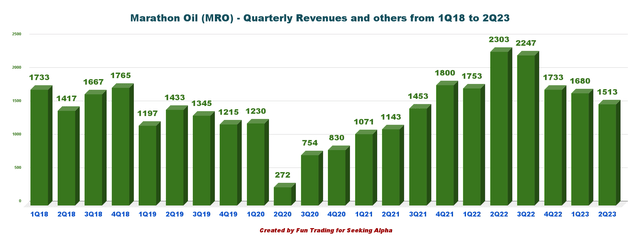
The company reported revenues of $1.513 billion, down 34.3% from the year-ago sales of $2.303 billion. The company maintained a quarterly dividend of $0.10 per share and executed $372 million in share repurchases in the second quarter.
Marathon Oil’s domestic production of 399K Boepd compared to 343K Boepd last year. Free cash flow in 2Q23 was $442 million.
The full-year 2023 total Company oil equivalent production is trending above the midpoint of the annual guidance range.
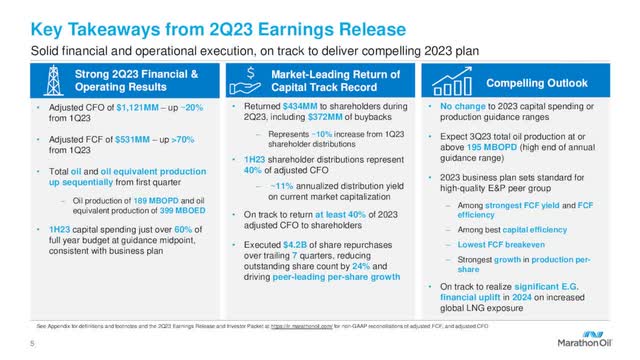
MRO 2Q23 Key Takeaways (MRO Presentation)
2 – Stock performance
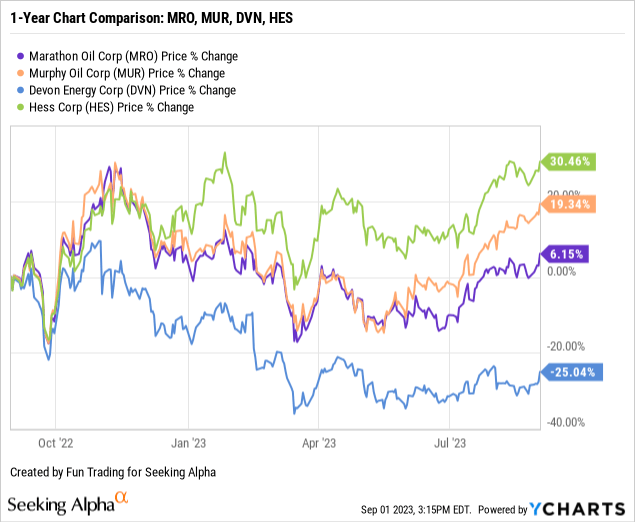
A quick one-year comparison with a few E&P (primarily domestic) shows that MRO underperformed the industry and is up 6% on a one-year basis.
3 – Investment thesis
Marathon Oil is an attractive E&P company and a significant U.S. E&P producer, with 89.2% of the total oil equivalent production in 2Q23 coming from the USA (with 51.8% oil). It provides solid support for the company’s long-term outlook.
I regard the recent acquisition Of Eagle Ford Assets Of Ensign Resources as a good decision, which has already delivered impressive results, with 156 Boepd in 2Q23.
The 130,000 net acres (99% operated, 97% working interest) Marathon Oil is acquiring from Ensign Natural Resources span Live Oak, Bee, Karnes, and Dewitt Counties across the condensate, wet gas, and dry gas phase windows of the Eagle Ford. Estimated fourth quarter 2022 oil equivalent production is 67,000 net boed (22,000 net bopd of oil). Marathon Oil believes it can hold fourth quarter production flat with approximately 1 rig and 35 to 40 wells to sales per year.
Also, oil prices have been bullish since July and support a solid cash flow generation.
On the negative side, the company dividend is quite low, with a dividend yield of 1.5%.
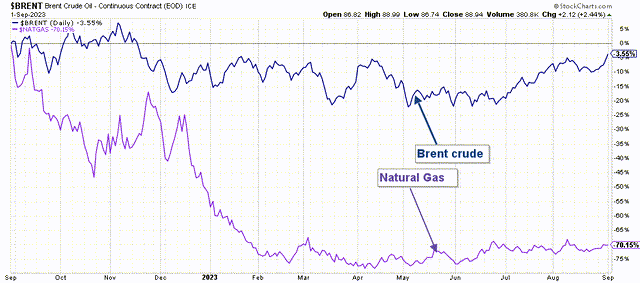
MRO 1-Year Chart Brent versus NG (Fun Trading StockCharts)
Thus, I recommend trading LIFO for about 45-50% of your position to take advantage of those fluctuations while keeping a core long-term position.
CEO Lee Tillman said in the conference call:
we delivered another very strong quarter on all fronts, highlighted by sequential increases to our cash flow from operations, free cash flow and our total company oil and oil-equivalent production. We delivered around $530 million of free cash flow during the second quarter, with a significant increase from first quarter driven by strong execution and improving production trend and a catch-up in EG cash distributions.
Marathon Oil – Financial Table 2Q23 – The Raw Numbers
| Marathon Oil | 2Q22 | 3Q22 | 4Q22 | 1Q23 | 2Q23 |
| Revenues from contracts in $ million | 2,168 | 2,008 | 1,603 | 1,567 | 1,484 |
| Revenues and others in $ Million | 2,303 | 2,247 | 1,733 | 1,680 | 1,513 |
| Net Income in $ Million | 966 | 817 | 525 | 417 | 287 |
| EBITDA $ Million | 1,608 | 1,333 | 1,574 | 1,025 | 988 |
| EPS diluted in $/share | 1.37 | 1.22 | 0.82 | 0.66 | 0.47 |
| Operating cash flow in $ Million | 1,678 | 1,556 | 1,127 | 865 | 1,076 |
| CapEx in $ Million | 355 | 430 | 333 | 532 | 634 |
| Free cash flow in $ Million | 1,323 | 1,126 | 794 | 333 | 442 |
| Total cash $ million | 1,162 | 1,109 | 334 | 178 | 215 |
| Long-Term Debt in $ million | 3,982 | 3,981 | 5,923 | 5,854 | 5,855 |
| Dividend per share in $/share | 0.08 | 0.09 | 0.10 | 0.10 | 0.10 |
| Shares outstanding (diluted) in Million | 705 | 672 | 639 | 629 | 615 |
| Oil Production | 2Q22 | 3Q22 | 4Q22 | 1Q23 | 2Q23 |
| Oil Equivalent Production in K Boe/d | 343 | 352 | 333 | 396 | 399 |
| US Onshore Crude oil price ($/b) | 110.10 | 93.67 | 84.29 | 74.69 | 72.49 |
Sources: Marathon Oil release.
Part II – Analysis: Revenues, Earnings Details, Free Cash Flow, Debt, and Oil and Gas Production
1 – Total revenues were $1,513 million in 2Q23
MRO Quarterly Revenue History (Fun Trading)
The second quarter’s revenues were $1,513 million, down 34.3% from the same quarter a year ago and down 9.9% sequentially.
Total costs in 2Q23 were $1,059 million from $1,009 million the prior-year period. Marathon Oil reported a CFO of $1,076 million for the second quarter, down significantly from $1,678 million a year ago.
1.1 – U.S. E&P
The segment reported an income of $365 million, down from $846 million in the year-ago period, due to lower oil realizations and higher costs, compensated in part by stronger production.
1.2 – International E&P
In Equatorial Guinea, the company reported earnings of $30 million compared with $160 million in the year-ago period. Lower output this quarter was to blame for the fall in earnings.
2 – Generic free cash flow was $442 million in 2Q23
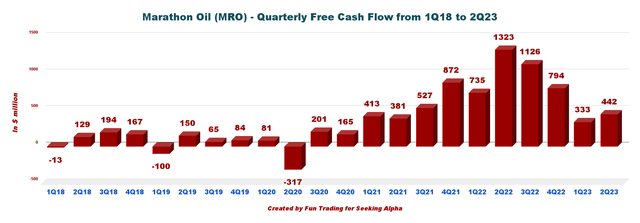
MRO Quarterly Free Cash Flow History (Fun Trading)
Note: The generic free cash flow is cash from operating activities minus CapEx.
Trailing twelve-month free cash flow was $2,695 million, with a 2Q23 free cash flow of $442 million. Dane Whitehead said in the conference call:
second quarter was a tremendous financial quarter for us as we generated $531 million of adjusted free cash flow and returned $434 million of capital back to shareholders. That’s a 10% increase in shareholder distributions relative to the first quarter. Importantly, we expect our financial delivery to improve even further over the second half of the year.
This quarter, the quarterly dividend was maintained at $0.10 per share or a dividend yield of 1.48%, which is particularly low for the industry.
3 – Production of oil equivalent was 399K Boepd in 2Q23
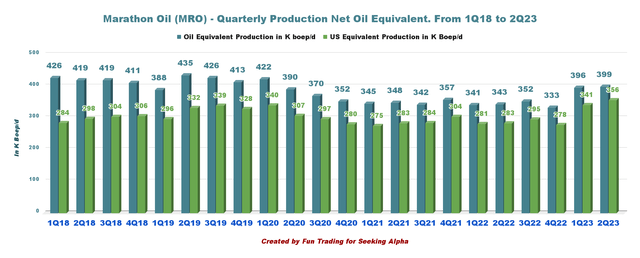
MRO Quarterly Production and US Production History (Fun Trading)
3.1 – U.S. segment
Total U.S. output (356K Boepd) comprised approximately 51.8% oil or 181K Bopd.
Eagle Ford production was significantly higher YoY, with 156K Boepd pumping a whopping 85.7% YoY after the acquisition of Ensign.
However, the Bakken production was 108K Boepd compared to 114K Boepd in the year-ago quarter. Finally, the Oklahoma output came in at 50K Boepd, down from the year-ago level of 56K Boepd.
U.S. unit production costs were $5.88 per Boe for the second quarter.
- Marathon Oil’s average realized liquids prices (crude oil and condensate) of $72.49 per barrel were down from the year-earlier level of $110.10.
- Average realized natural gas prices were down 72.4% year-over-year to $1.89 per Mcf.
- Natural gas liquids average price realizations decreased by 53.6% to $18.72 a barrel.
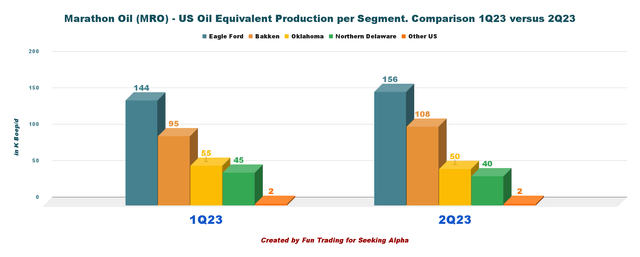
MRO Production per Segment 1Q23 versus 2Q23 (Fun Trading)
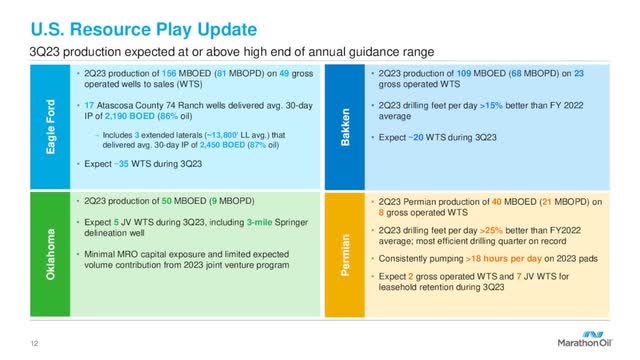
MRO Highlights per Basin (MRO Presentation)
3.2 – Equatorial Guinea
Production was 43K Boepd in 2Q23, down from 60K Boepd last year.
Marathon’s average realized liquids prices were $53.64 per barrel, down 32.7% from the year-earlier quarter. Natural gas and natural gas liquids’ average price realizations came in at $0.24 per thousand cubic feet and $1 a barrel, unchanged from a year ago.
On March 30, 2023, Marathon Oil signed an HOA with Chevron (CVX) and the Republic of Equatorial Guinea to progress the following phases (Phases II and III) in the development of the Equatorial Guinea Regional Gas Mega Hub (GMH). Phase I is already been completed. Phase II will materially increase MRO Global LNG exposure and cash flow (see map below).
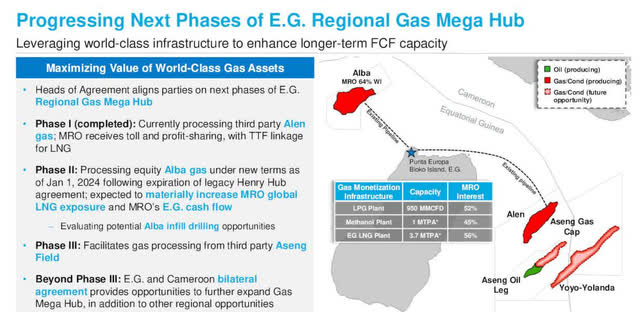
MRO EG Regional Gas Hub (MRO Presentation)
3.3 – Oil and gas prices
Marathon Oil’s average realized liquids prices (crude oil and condensate) of $72.49 per barrel were below the year-earlier $110.10.
Natural gas liquids’ average price realization was $18.72 a barrel.
Also, the average realized natural gas prices were $1.89 per thousand cubic feet in 2Q23.
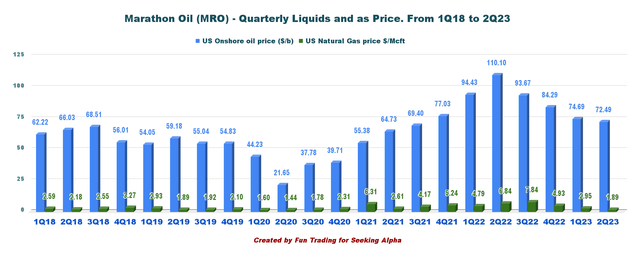
MRO Quarterly Oil and NG prices (Fun Trading)
4 – Net debt was $5.64 billion in 2Q23
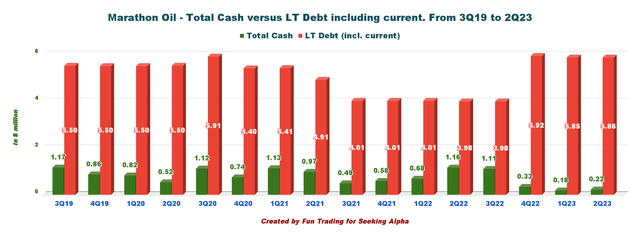
MRO Quarterly Cash versus Debt History (Fun Trading)
As of June 30, 2023, MRO had cash and cash equivalents worth $215 million and long-term debt of 5.855 billion, including current.
Note: The Company redeemed $131 million of 8.125% Senior Notes in July, bringing year-to-date gross debt reduction to $200 million.
Marathon Oil ended the second quarter with a total liquidity of $2.1 billion. Available borrowings on the Company’s revolving credit facility have been extended to 2027.
The debt-to-capitalization ratio of the company was 34.2.
5 – 2023 Guidance unchanged
Marathon Oil announced a $1.9 to $2.0 billion capital expenditure budget for 2023.
Marathon Oil expects oil production of 190K net bopd at the midpoint of its 2023 guidance range.
Total Company oil-equivalent production is expected to be 395K net boepd at the guidance’s midpoint, including downtime associated with a planned second-quarter Equatorial Guinea turnaround.
Furthermore, Marathon expects oil volumes in the band of 185K-195K barrels daily, with 177K-185K barrels daily for the USA.
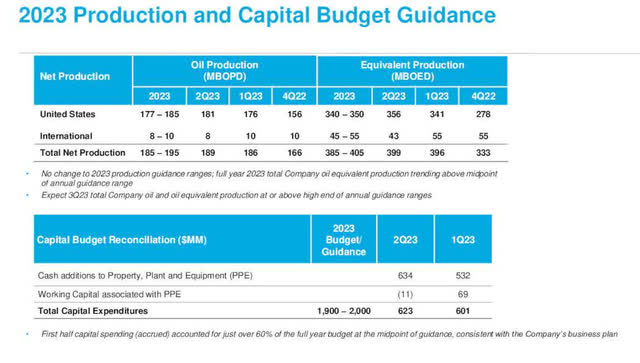
MRO 2023 Production and CapEx Guidance (MRO Presentation)
CEO Lee Tillman said in the conference call:
For third quarter specifically, we expect total company oil and oil equivalent production to be at or above the high end of our annual guidance range before a modest sequential decline into the fourth quarter. For full year 2023, we’ve reiterated our production guidance ranges of forward trending above the midpoint of guidance on an oil equivalent basis.
Technical Analysis (Short Term) and Commentary
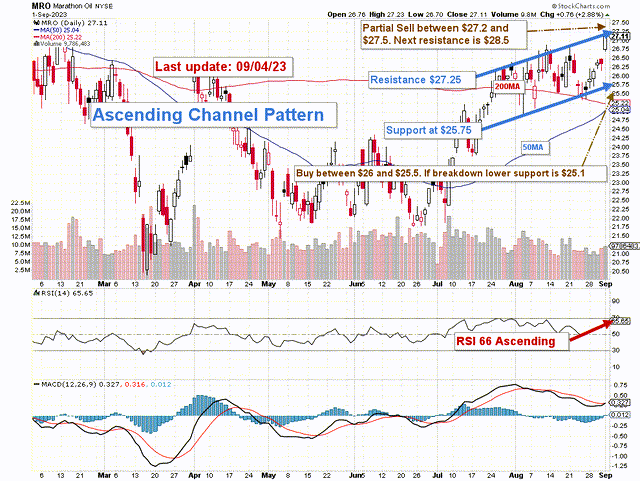
MRO TA Chart short-term (Fun Trading StockCharts)
Note: The graph is adjusted for the dividend.
MRO stock prices form an ascending triangle pattern with resistance at $27.25 and support at $25.75. RSI is now 66 and is near an overbought level, which suggests a possible retracement soon.
Ascending channel patterns or rising channels are short-term bullish in that a stock moves higher within an ascending channel, but these patterns often form within longer-term downtrends as continuation patterns. The ascending channel pattern is often followed by lower prices, but only after a downside penetration of the lower trend line.
The trading strategy is to sell about 45-50% of your MRO position between $27.2 and $27.50, with possible higher resistance at $28.5.
Conversely, I recommend buying MRO stock between $25.5 and $26, with potential lower support at $25.1.
Watch oil and gas prices like a hawk.
Warning: The TA chart must be updated frequently to be relevant. It is what I am doing in my stock tracker. The chart above has a possible validity of about a week. Remember, the TA chart is a tool only to help you adopt the right strategy. It is not a way to foresee the future. No one and nothing can.
Read the full article here

