
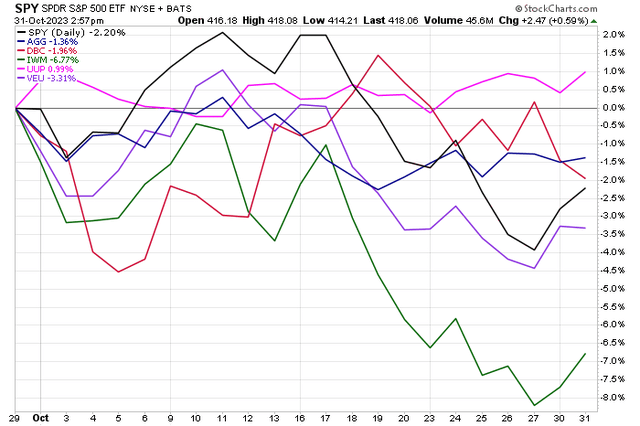
Stocks fell for a third straight month as fears of a growth slowdown amid still-rising interest rates have weighed across asset classes, investment styles, and market caps.
All told, the S&P 500 ETF (SPY) fell 2% in October with the Nasdaq Composite participating in the downside. Small caps, however, were the notable laggards with the Russell 2000 ETF (IWM) dropping 7%. Away from the US, foreign stocks, as measured by the Vanguard FTSE All-World ex-US ETF (VEU), gave back 3% while the US Dollar ETF (UUP) continued its steady climb that began in earnest in July.
In the fixed-income space, the US Aggregate Bond ETF (AGG) fell alongside stocks, though AGG’s 1.5% total-return loss was not a major blow as some bond buyers stepped in by late in the month. There was action in the commodities markets with oil having one of its worst months in the last year while gold shined, jumping to within dollars of an all-time monthly high close. Overall, the broad commodities tracking fund (DBC) finished lower by 2%.
Equities, Bonds Spooked In October, Dollar Rallies
Stockcharts.com
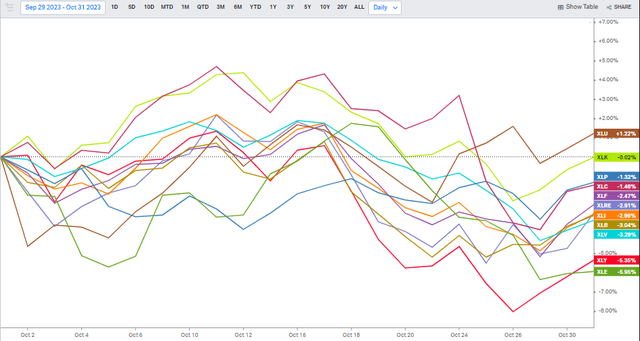
Drilling down to the sector level, only the boring and beaten-down Utilities niche was solidly positive in what’s notoriously the most volatile month on the calendar. Tech was about flat but the growth-heavy and cyclically exposed Consumer Discretionary sector, along with Energy, brought up the rear. Recall that the Utilities Sector SPDR ETF (XLU) was pummeled in September given the surge in Treasury yields. Often seen as a bond proxy, investors shunned the debt-laden domestic area but then rotated modestly back into the mid-teens-P/E “Utes” sector over the final week of October. Likewise, the Consumer Staples ETF (XLP) featured modest relative strength following a tough end to Q3.
October Sector Performances: Utes In the Black, Mainly Struggles Elsewhere
Koyfin Charts
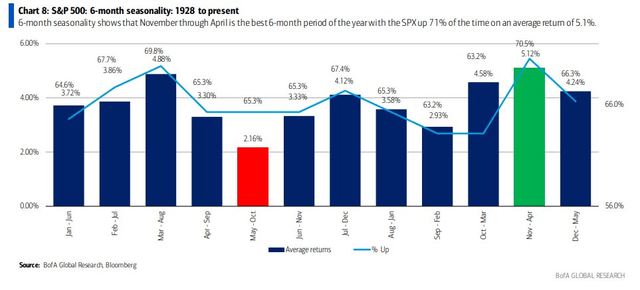
Looking ahead, we’re now entering the most favorable period for US equities. The November through April stretch normally features solid gains, and data from Bank of America Global Research confirms that, since 1928, the S&P 500 has been higher 71% of the time with an average return of 5.1%. Will that hold this time? Many people appear to be banking on it. Read on.
Strong Seasonality Starts Now
BofA Global Research
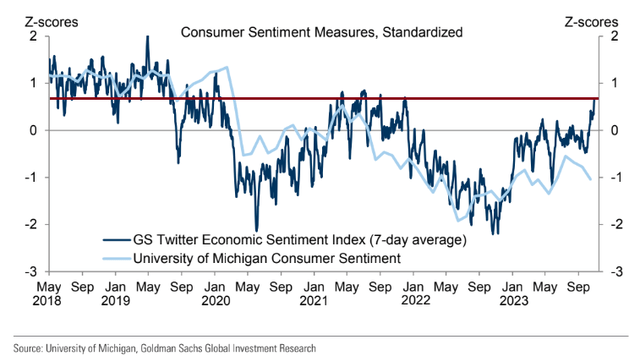
I found that Goldman Sachs’ Twitter Sentiment Index is at the frothiest levels in many months. Of course, that can be offset by bearish gauges from the American Association of Individual Investors, the CNN Fear & Greed Index, and generally lousy consumer and investor confidence barometers.
Still, despite the SPX being near correction territory and with the Russell 2000 down more than 30% from its all-time high hit nearly two years ago, I don’t see signs of a true washout or capitulation stance among investors writ large.
Goldman’s Twitter Sentiment Gauge: Too Bullish?
Goldman Sachs
US Consumer Confidence Drops to a Five-Month Low on Inflation
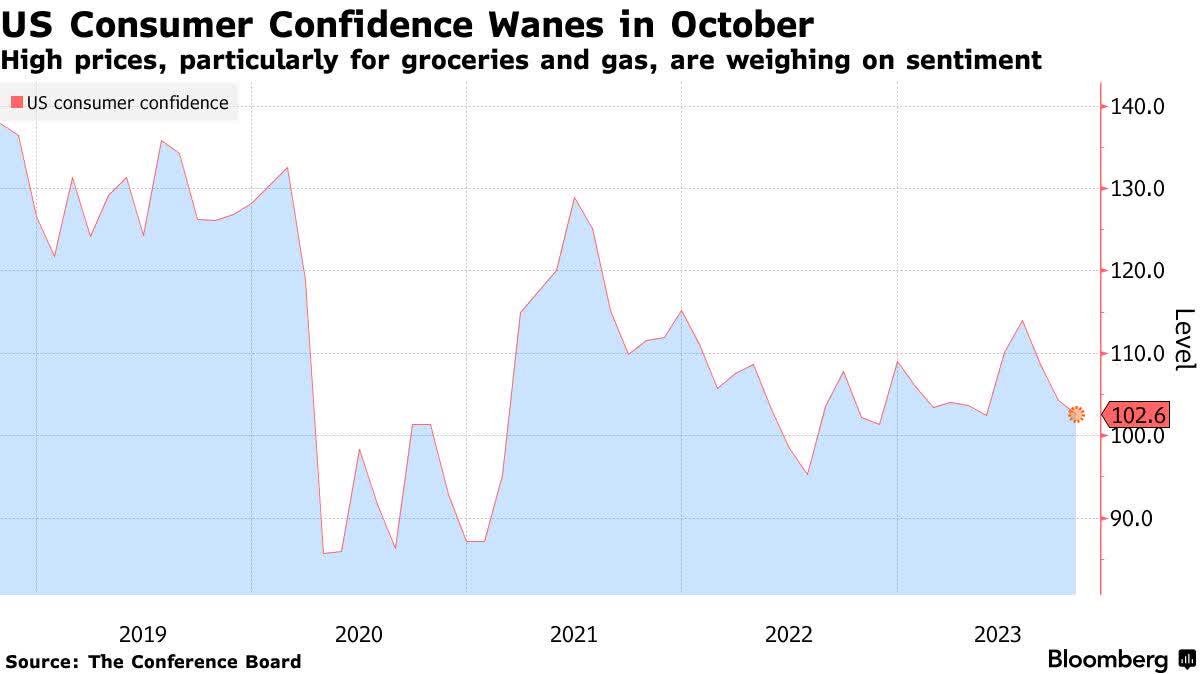
Christophe Barraud, Bloomberg
On the earnings front, the third quarter reporting period has gone fairly well, but the price-action theme has been awful individual stock reactions. According to FactSet, earnings misses have been punished hard but firms beating on the bottom line have been generally sold off too.
That’s bear market behavior, or at least indicative that the correction since July remains in place. I would like to see a better back half of the Q3 earnings season in terms of next-session performances. The upside is that equities are priced less expensive today. Furthermore, with the Fed perhaps done with its rate-hiking campaign, less hawkish monetary policy could be an emerging tailwind for equities in 2024.
Darned If You Beat, Darned If You Miss
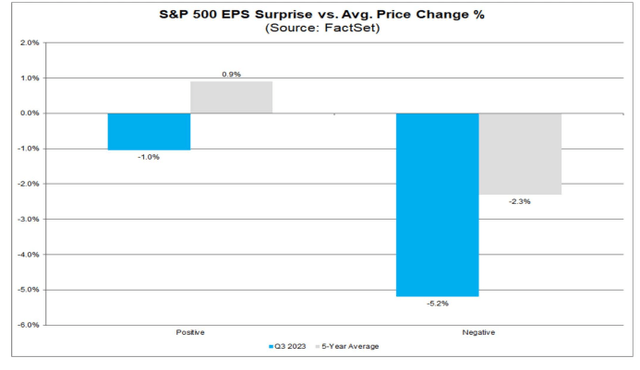
FactSet
Let’s zoom out a bit and simply focus on where the US stock market may go. A growing ETF to gain exposure to domestic stocks is the Schwab U.S. Broad Market ETF (NYSEARCA:SCHB). I’m upgrading the ETF from a hold to a buy given better valuations and seasonal strength that usually begins to show itself. Also, SCHB is ideal for long-term investors given its diversification, low cost, and strong liquidity.
According to Schwab, SCHB seeks to track, as closely as possible, before fees and expenses, the total return of the Dow Jones U.S. Broad Stock Market Index. It’s a straightforward, low-cost fund offering potential tax efficiency and can serve as part of the core of a diversified portfolio. Exposure covers the 2500 largest publicly traded US companies and the index SCHB tracks is designed to provide a comprehensive measure of large-cap, mid-cap, and small-cap domestic stocks.
With a more than 13-year track record, SCHB is low-cost at just a 0.03% annual expense ratio and its 1.6% dividend yield is in line with the S&P 500’s average. Total assets under management sums to $21.6 billion and average daily volume is near 750k. The 30-day median bid/ask spread is narrow at just two basis points. Share-price momentum has been soft in the last three months given its more than 11% Q3-Q4 max drawdown.
I was neutral on the fund in May, and though the market advanced over the ensuing two months, the rally was not on firm footing. At last check, the forward P/E ratio on the broad US stock market is closer to 17 than 18, so valuations have come in from lofty levels from Q2 and Q3.
The 3-star, gold-rated total market index ETF features a growth orientation given the market-cap weighing structure. The so-called Magnificent Seven represent nearly a quarter of the portfolio, with Berkshire Hathaway (BRK.A) and United Healthcare (UNH) rounding out the top 10 holdings. While slightly more diversified than the SPX, there remains a high 28% weighting to the Information Technology sector and Energy, Real Estate, Utilities, and Basic Materials make up a small cumulative weight in SCHB.
SCHB: Portfolio and Factor Profiles
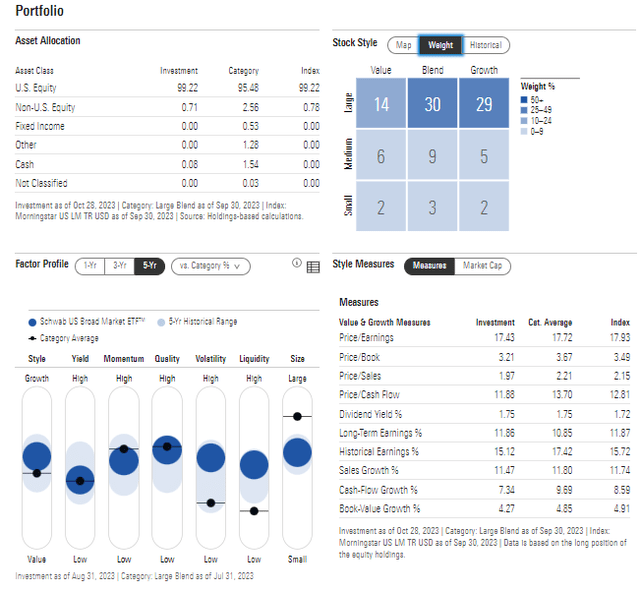
Morningstar
SCHB: Portfolio Breakdown, Dividend Information
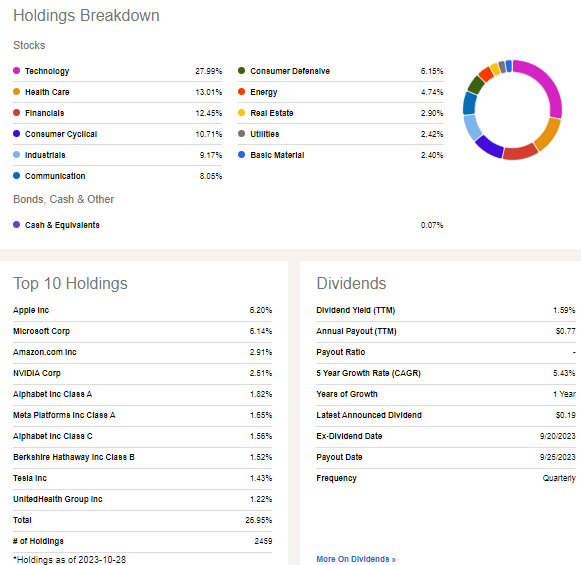
Seeking Alpha
The Technical Take
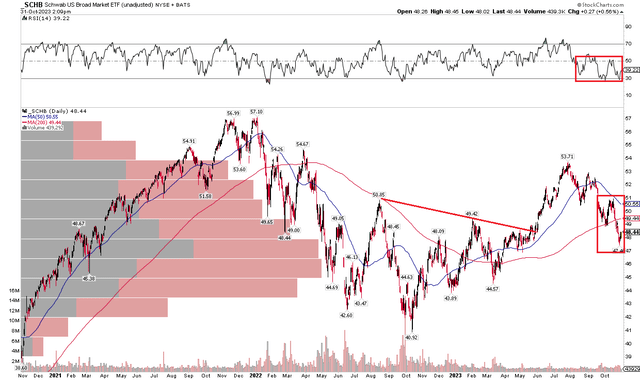
With the overall market priced better when examining P/E multiples, the technical situation is less sanguine. Notice in the chart below that SCHB is now firmly under its flattening 200-day moving average. They say that nothing good happens under the 200-DMA, so this is a bearish signal even with bullish seasonality underway. Also, take a look at how the US stock market fund is below a key breakout point that took place shortly after my initial analysis on SCHB.
I would like to see the ETF climb back above $50 to negate some of this negative behavior, but with the RSI momentum indicator at the top of the graph in the 20 to 60 bearish range, there’s no firm evidence that’s underway. I see support in the $43 to $45 area – that has been an important zone since May last year. On the upside, $51 could be a point of possible selling pressure.
Overall, SCHB’s momentum has been very weak since July, and making a bullish call here is not without its risks.
SCHB: Technical Risks Remain, Shares Under 200-DMA
Stockcharts.com
The Bottom Line
I’m upgrading SCHB from a hold to a buy on valuation and seasonality. I concede that the technical situation remains precarious, but strong fundamentals and earnings make for a better risk/reward given the 10% pullback.
Read the full article here

