
Micron (NASDAQ:MU) just dropped after reporting earnings, and we think this will trigger our buy-on-weakness signals because it has our proprietary Stocks In Demand or SID Buy Signal and is already in our 2024MP Model Portfolio. The charts below show the short-term Sell signal on the daily chart and the longer-term Buy signal on the weekly chart.
MU is outperforming the Index on a trend basis, shown on our weekly chart below, and portfolio managers love that. We expect them to add to their positions on any pullback like this post earnings one. That is what happened last time.
We have identified support levels on the daily chart. Let’s see which one is the bottom to buy on weakness. We will see it on the chart when portfolio managers start buying it again at lower prices. If they do not return to buy on weakness, that would be a bearish signal.
We like to check with SA analysts and Quant scores to do our due diligence on our own Buy signal for MU and whether we should continue to hold it in our Model Portfolio. For the five SA analysts writing after MU earnings, three had Buy ratings and two analysts had Hold ratings. The consensus for all the SA analysts is a Buy rating, and the latest analysts are pointing to a Hold or a Buy. Therefore, we would continue to hold it in our portfolio.
The SA Quant rating is also a Hold, so this also would confirm our decision to Hold. These ratings show top grades for Growth, Momentum, Revisions and Profitability. However, MU gets an F for Valuation, and therein lies the problem. That is why price is pulling back after earnings. When Valuation becomes acceptable to portfolio managers, they will start buying on weakness again, as they have in the past with MU. We don’t guess when that will happen. We just watch the charts to know when it happens. We will, of course, let you know.
SA is also reporting that the consensus Wall St. analysts’ rating is a Strong Buy. This agrees with our own, proprietary Strong Buy signal shown at the top of the weekly chart below. It is possible that some of these analysts may drop to a Hold signal after MU earnings, but that may only take the consensus down from a Strong Buy to a Buy rating. These analysts are strictly fundamentalists and change their ratings when stocks are extremely overvalued. We will keep an eye on SA’s tracking of these analysts now that earnings are out.
Here is the daily chart showing the short-term Sell signals on the chart and the drop in price, looking for a support level that will hold for the bounce back up:
MU short term sell signals on the daily chart. (stockcharts.com)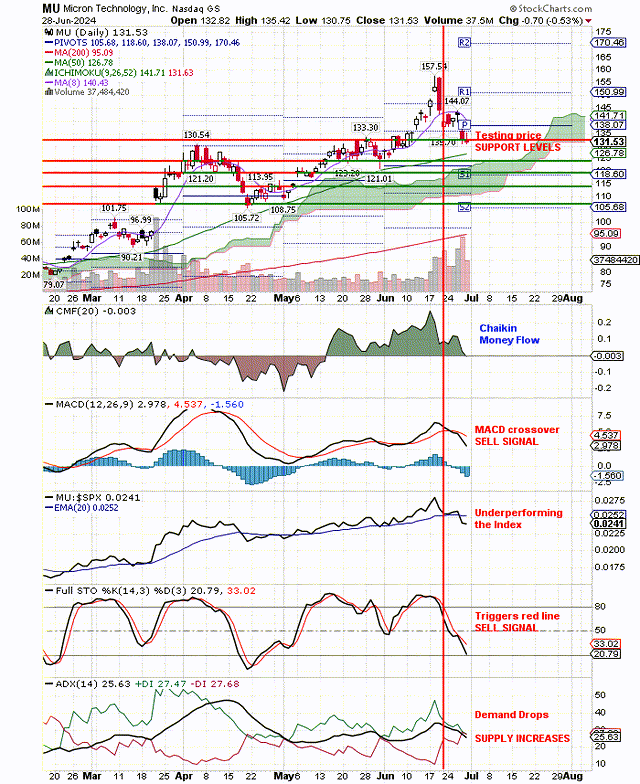
At the top of the above chart you can see the big, reversal day, Sell signal confirmed by high volume, higher than the last pullback in price. Thus, we expect the first support level to fail. Price is dropping to test the 50-day moving average uptrend, as it did last time. Price has already broken below the first support level at $133.
Below price is Chaikin Money Flow and you can see this dropping sharply, which is a Sell signal. Below that is the MACD signal, and you can see the crossover of the black line below the red line, which is a Sell signal. Next is Relative Strength, relative to the Index, and you can see it breaking down and under-performing the Index on a short-term basis. That’s bearish short term.
Next is the most important signal for us because we use it to draw our vertical, red line Sell signal on the daily chart. This is the Full Stochastic signal. Finally, at the bottom of the chart is the ADX signal, and you can see the crossover of Supply over Demand as Supply on balance takes price lower.
When will the buying start? When we see all these signals improving, and we change that red line Sell signal to a blue line Buy signal. We will keep you posted. Let’s move on to the longer-term Buy signal that is still in place but under attack.
Here is the longer term, weekly chart, with our strong Buy signal shown at the top of this chart:
MU weekly chart showing Buy signals under attack. (stockcharts.com)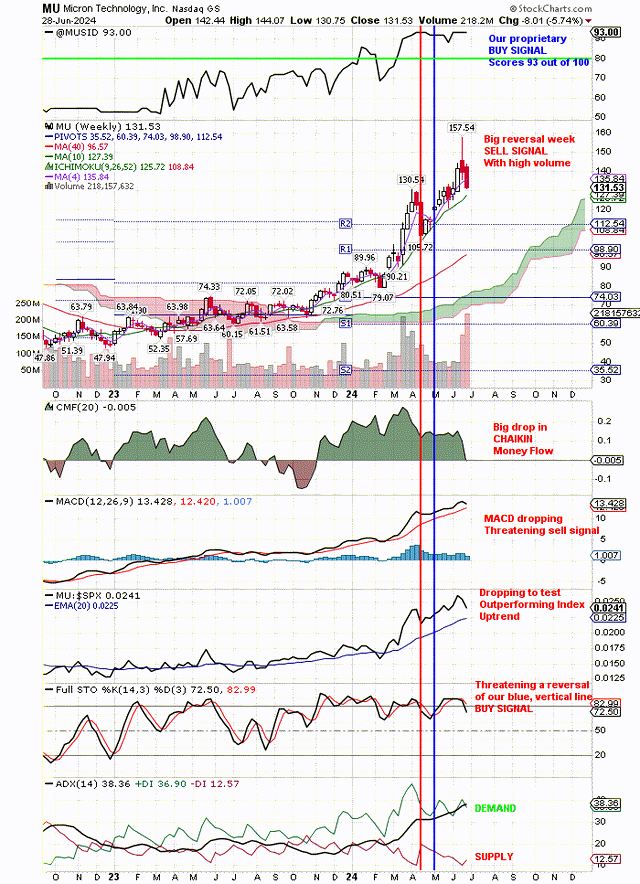
Not only does the above weekly chart have our own Buy signal at the top, but it also still has our blue, vertical line, technical Buy signal triggered by the Full Stochastic. However, it is under attack. Notice that on the last pullback it triggered a red line, technical Sell signal. But at the top of the chart, you will see that the technical Sell signal had no effect on our own Buy signal. That is because our Buy signal at the top of the chart uses both technicals and fundamentals.
Also notice at the bottom of the chart that on the last pullback in price, ADX Demand dropped but remained in control. The same is happening so far with this pullback. If there is any change in the ADX signal or our own proprietary Buy signal, we will let you know. Otherwise, our buy on weakness signal will continue, and we will expect to see the buyers come in to change the current Sell signals.
Read the full article here

