
Introduction
The Momentum Mojo article builds on many prior signal event articles with more explanations on how to benefit from one of the most popular features of the Value & Momentum Breakouts investing group. As more data points are collected, more insights are gained. We are seeing the strongest and broadest breakout in the markets since January, but many risks lie ahead.
After very strong gains in January, this past February signaled the largest market topping signal since August 2022. Since then, many sectors have declined, with financials among the hardest hit sector this year. A banking crisis followed directly after the February negative signal, and we have been waiting through May for signs of a broad positive market signal. While the Technology sector has been led by a few mega caps in strong positive momentum, it has been a narrow trade that left both the DJIA (DJI) and Russell 2000 (RTY) indices in negative territory through May. Momentum is shifting.
Momentum Gauges Dashboard
Market daily gauges, S&P 500 (SP500), and sector gauges are highly positive in the first broad rally in months. All the sectors turned positive this week in the strongest broad market move since January. Money flows to oversold sectors like financials, energy, and basic materials may accelerate as long as the U.S. dollar continues to decline from peak levels in May.
app.VMBreakouts.com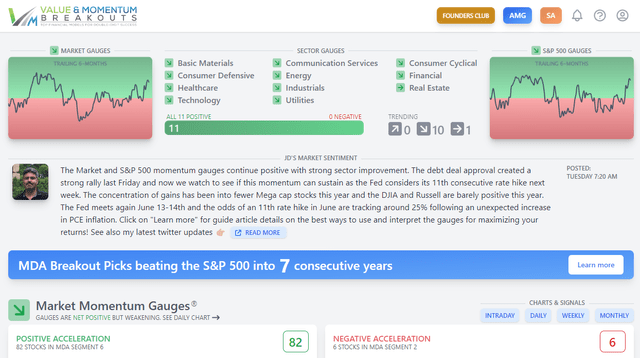
- Guide: Maximizing Market Returns With The Automated Momentum Gauges.
Market Momentum
Momentum continues to rocket higher again this week after it broke out above 70 on Friday following some of the choppiest weeks on the signals that we have seen in years. This long period of chop was largely due to concerns about a debt default with frequent sector rotation to safety. This week we are seeing the strongest breakout since January as detailed here last week:
- Momentum Memo: Biggest Shift Into Lagging Value Sectors In Friday Breakout.
The most important money flows to watch right now is the shift toward small caps and oversold value stocks and away from high overbought mega/technology stocks. This is illustrated in the contrast between the Russell 2000 index fund (IWM) and the 10 stock MicroSectors FANG+ Index 3X Leveraged ETN (FNGU) shown below. Watch for alternating dip-buying in the strongest breakout signal since January with many similarities to the prior stair step patterns.
FINVIZ.com VMBreakouts.com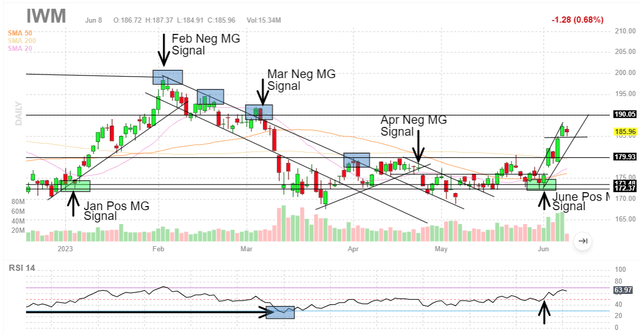
MicroSectors FANG+ Index 3x bull fund
The concentration of gains into the 10 largest mega caps is reaching peak levels last seen in January 2022. Expect normal profit taking to benefit the small caps and lagging value sectors in alternating market breakouts.
FINVIZ.com VMBreakouts.com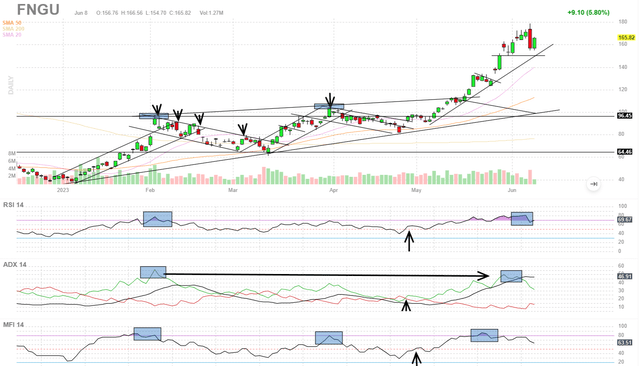
The Mega Cap share of the S&P 500 growth is concentrated with over 50% growth from Alphabet (GOOG, GOOGL), Microsoft (MSFT), Apple (AAPL), NVIDIA (NVDA), Meta (META), Netflix (NFLX), Amazon (AMZN) and Tesla (TSLA). These levels reflect peak pricing back to January 2022 without broad market participation.
Yardeni.com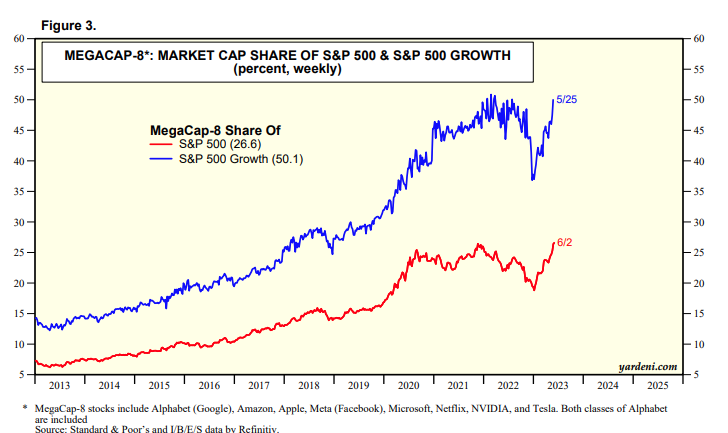
Daily Market Momentum Gauges YTD
Momentum has cleared the choppy equilibrium range (yellow) as detailed last week, and unlike the mid-May jump, all the sectors are still participating in the breakout. There is a much better chance that this bounce will sustain for the oversold sectors.
app.VMBreakouts.com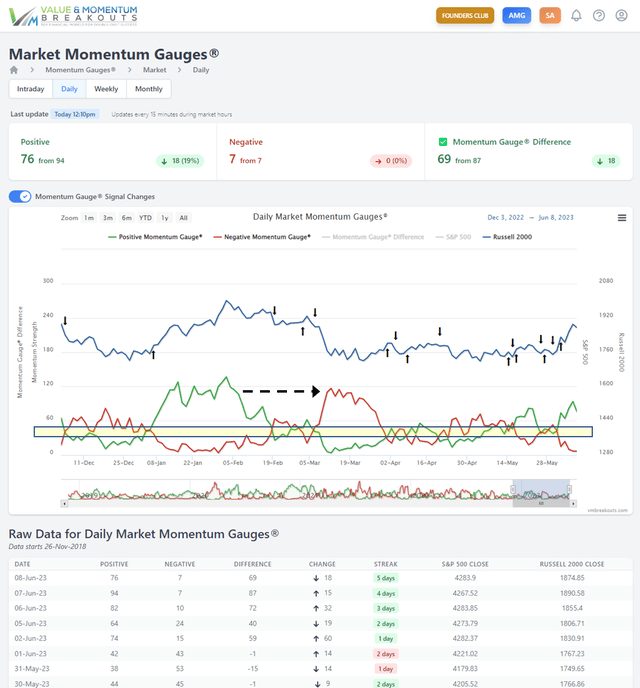
Weekly Momentum Gauges YTD are heading toward a 4th consecutive positive week with much less noise than the daily gauges. The weekly chart also illustrates the unexpectedly strong momentum conditions in January that topped in February ahead of the recent banking crisis.
app.VMBreakouts.com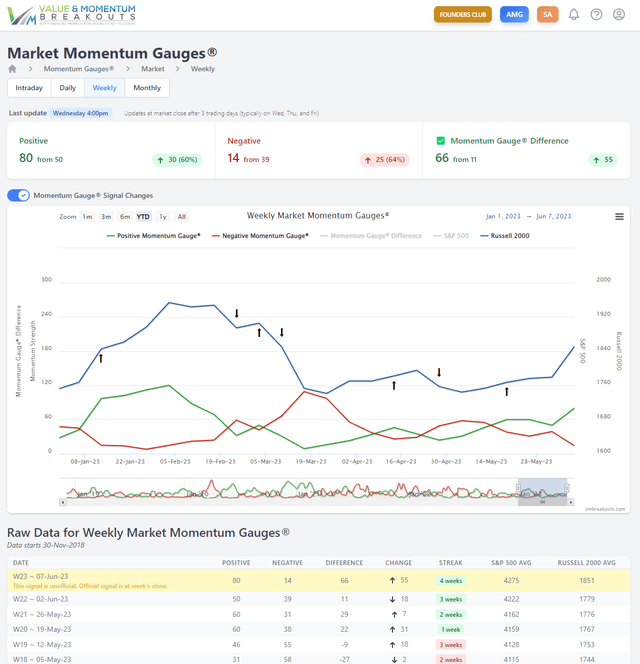
These weekly momentum moves also correspond strongly inverse to the movement of the Invesco DB US Dollar Index Bullish Fund ETF (UUP) shown below. As the dollar declined into January, we had a strong rally that peaked at the end of February. As May comes to a close with the dollar index at the highest levels since March, we are clearly headed toward another rebound off the lows of this cycle.
FINVIZ.com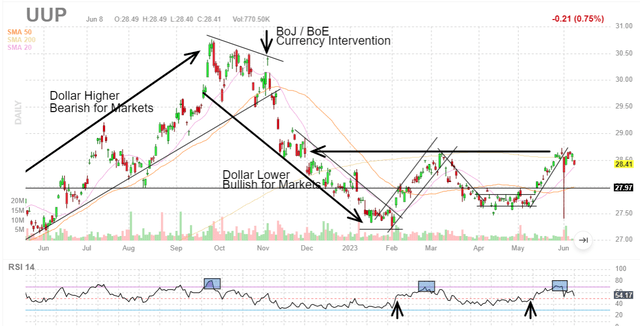
Why do finance companies admit that “timing is everything,” but when it comes to investing your money, the majority tell their clients to “just buy/hold and try to ignore the downturns?” I submit most investors would rely on timing signals, but without a model like the gauges they are forced to try to keep their clients in buy/hold positions for 24 months with no gains, or worse.
If timing helps you gain just 1% a week, you will significantly outperform all the long-term market averages.
Long time members know, we can consistently beat the markets by avoiding the most negative weeks and loading up during the most positive signals. Only the financial industry has incentives to make you stay in the markets year round.
FINVIZ.com VMBreakouts.com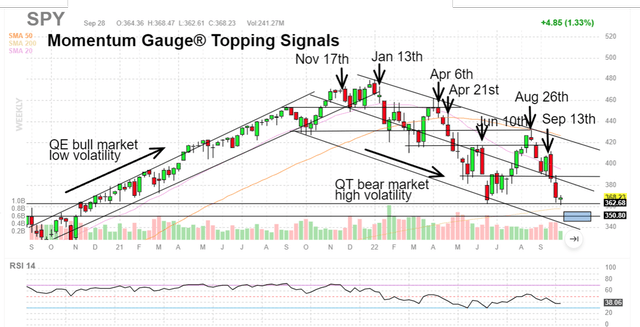
2023 Market Outlook
Next week is key with the Fed FOMC rate decision on June 14th. The Fed has already delivered its 10th consecutive rate hike in the fastest series of increases since 1977. The S&P 500 (SPX, SPY) is still negative since the Fed began its tightening program on March 9th, 2022 and began hiking rates early last year. After the latest PCE inflation unexpectedly increased again, the odds of an 11th hike in June jumped to 66.5% and have fallen back to 25% on the CME FedWatch Tool. Historically, such high rates have led to a market correction after every rate hiking cycle in U.S. history. Although I am pleased to report current positive momentum, the largest QT program in history is still ongoing to reduce the Fed’s balance sheet at the fastest rate ever conducted, with target levels of -$95 billion per month.
Yardeni.com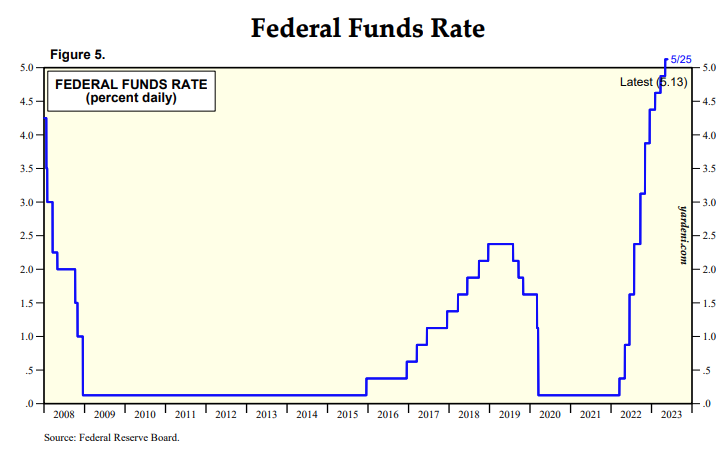
My strategy for 2023 is to stay generally bearish while adjusting for large bear bounces in anticipation of strong similarities to the August topping pattern last year. Economic data, inflation, manufacturing productivity, home sales, and the latest banking crisis continue to show recessionary weakness into rising interest rate hikes at the highest levels since Sep 2007.
Current Returns by portfolio type through yesterday
Note that the MDA breakout returns with signal have fewer trading weeks but much higher per/week percentage returns as explained in the Weekly MDA Breakout articles. The long-term buy/hold portfolios continue to outperform the S&P 500 every year.
VMBreakouts.com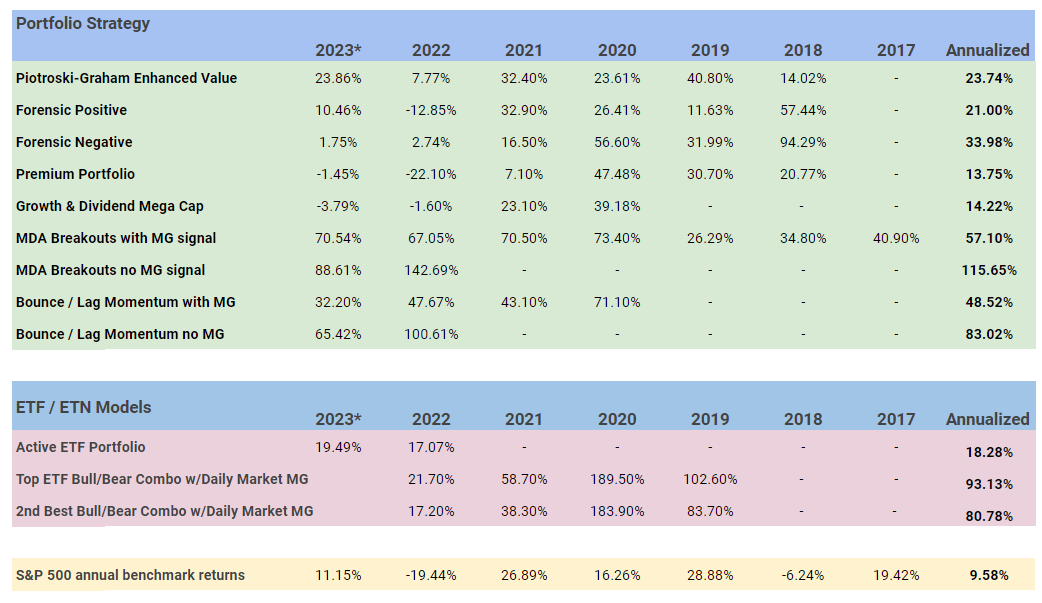
Mid-year 2023 is nearly here and things may get interesting with potential for a Fed pivot. Dip-buyers will continue to try to pull this anticipated pivot event forward in time, extending high market volatility while the Fed hikes rates.
The new June Russell Reconstitution anomaly report will be released again in June with the latest stocks for 2023. Here is my review from last year.
Some of my forecast articles for 2023 are here for your benefit.
Sector Momentum
For this article, I want to highlight again just two of the eleven sector gauges in particular. The differences between these two sectors also accounts for much of the extreme chop in the markets recently. The Momentum Gauge ETF model follows the signals with returns shown below for signals lasting more than 3 days.
VMBreakouts.com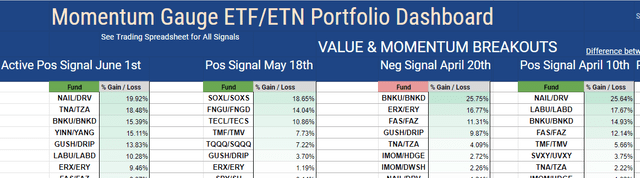
Technology Momentum Gauges continue for a fourth week to be the breakout sector, but momentum is weakening. Negative gauges continue to drop sharply from the peak of negative momentum on May 4th. The Direxion Daily Technology Bull 3X Shares ETF (TECL) has gained over +38% from May 4th and could continue toward January peak positive momentum levels at 180. The technology sector is the highest weighted and largest sector on the major market indices, especially the Nasdaq and related index fund (QQQ). As long as technology momentum increases it will benefit technology funds like Direxion Daily Semiconductor Bull 3X Shares ETF (SOXL) and the Mega cap bull funds comprised mostly in technology like MicroSectors FANG+ and FANG Innovation 3x funds (FNGU) (BULZ).
app.VMBreakouts.com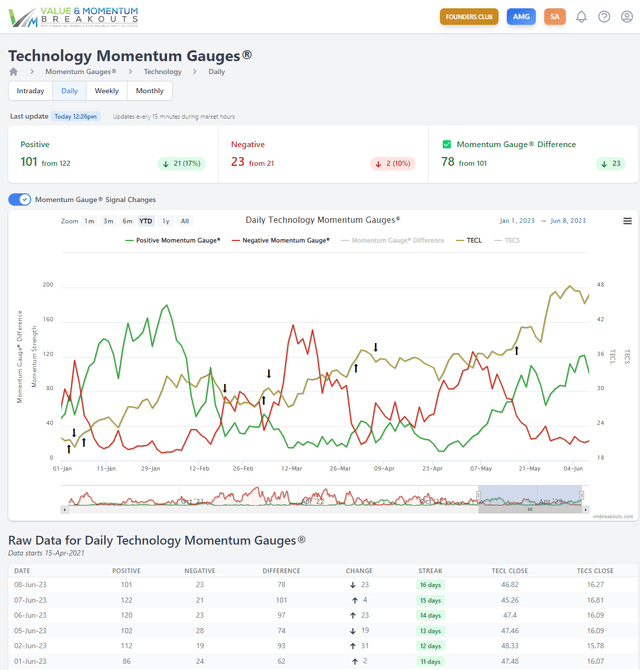
Financial Momentum Gauges have been the most negative sector this year from the February 21 signal in advance of the March banking crisis. This past Friday gave us only the 2nd and most positive signal in over 71 days. Since that negative market and sector gauge signal, the (FAZ) -3x Financial bear fund has gained +29.8%. This new positive sector signal could mark the start of a longer rebound in banks, with the (FAS) 3x Financial bull fund and related (BNKU, DPST) for strong potential gains.
app.VMBreakouts.com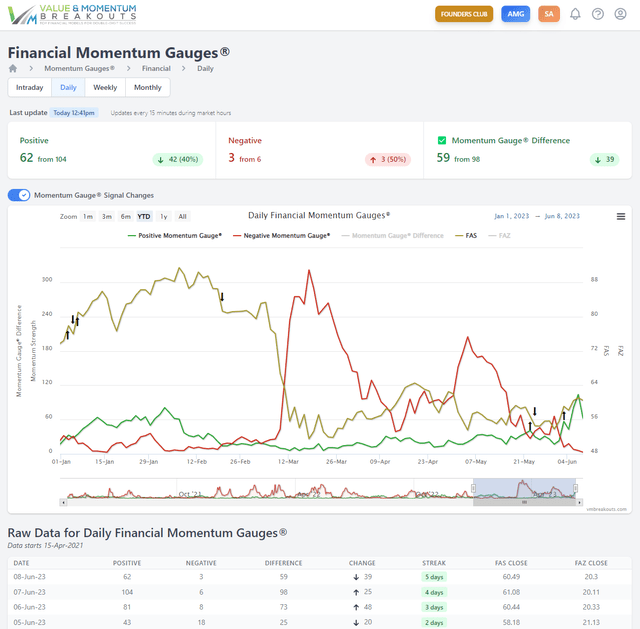
The Regional Bank small cap breakout
The 3x bull fund for small banks is showing a strong early breakout with bullish stair steps alternating with the mega bounces. It takes a lot less capital to move these small caps and as more investors bank profits from elevated mega caps the inflows to small caps like biotechs, regional banks, and retailers could benefit greatly from here.
FINVIZ.com VMBreakouts.com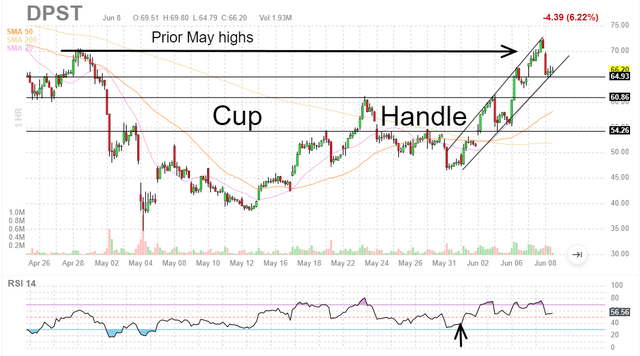
Prior Negative Signals In Advance Of Major Downturns
One of the most popular uses for the gauges is to get advanced warning signals ahead of major market downturns in order to protect your investments. Examples of prior major market topping signals including the 2018 quantitative tightening (QT) correction and the 2020 Covid correction are shown below.
VMBreakouts.com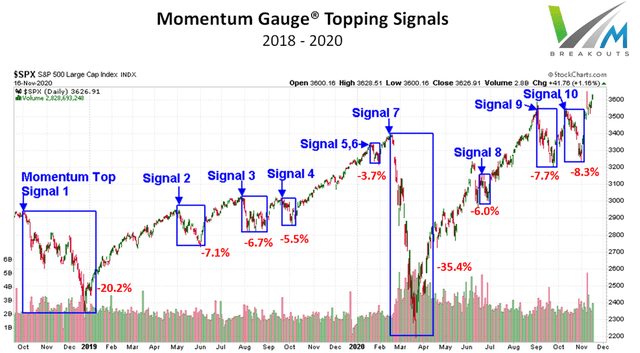
The point of this illustration is that a majority of all the signals detected so far were events exceeding -5% S&P 500 declines to as much as -35%, including one of the worst one-month declines in history. I always publish many more current examples and signal articles throughout the year for anyone interested in following my market updates.
Review Of Prior Signals
-
Signal 19 (November 17th, 2021) Momentum Gauge Topping Signal: The Second Largest 2021 Negative Signal To Date
- Signal 16 (June 17th, 2021) Momentum Gauge Topping Signal June 17: The Largest Negative Signal In 2021
- Signal 11 (January 29, 2021): First Negative Momentum Gauge® Signal For 2021: Reviewing The Signals | Seeking Alpha Marketplace
- Signal 9-10 (September 13, 2020): An Election Year Correction Signal And Only The 3rd Negative Weekly MG Signal In 2020
- Signal 8 (June 24, 2020): Evaluating The 8th Market Correction Signal On June 24th That Has Preceded Every Recent Decline
- Signal 7 (March 23, 2020): Revisiting The Signals That Forecasted Every Recent Decline, In Search Of Early Recovery Indicators
- Signals 4-6 (Jan 28, 2020) : Revisiting The Signals That Forecasted Every Major Downturn Since “Volmageddon”: What’s Next
- Signals 1-3 (Aug 8, 2019): These 3 Measures Forecasted Every Major Downturn Since QT Started: What’s Next
Conclusion
The Momentum Gauges continue as part of an active research project that has delivered highly profitable results to many readers of my published financial articles. I continue to enhance the model as we gather more data over many more months and years. The current market conditions with increasing rate hikes and the largest Fed quantitative tightening program in history may contribute to weaker than average performance for 2023.
Historically, from 1950, the six-month period between May to October delivers the lowest average returns for the S&P 500 relative to all six-month periods. The current Fed tightening conditions and approach of a potential recession are not factored and may further increase the market risks this year.
LPL Research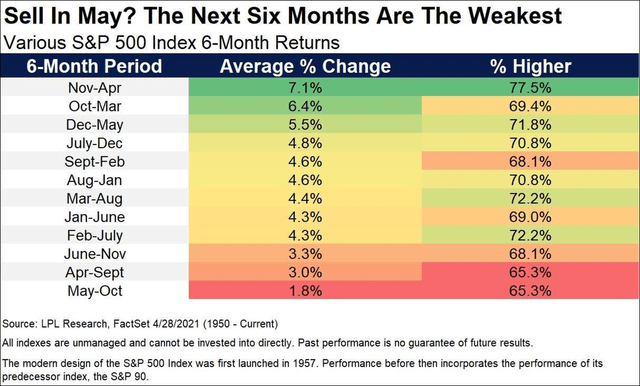
Future Updates and Cautions: If you would like notifications as to when my new articles are published, please hit the button at the bottom of the page to “Follow” me. If you are a short-term trader, weekly breakout picks are released every week and the new long-term portfolios will be released mid-year in July. The current buy/hold January Piotroski-Graham value portfolio is up over 23% YTD. Please be sure to check the links to the background articles for detailed research information and optimal trading strategies.
I hope this analysis provides you with additional market insight that benefits your trading in the days ahead!
JD Henning, PhD, MBA, CFE, CAMS.
Read the full article here

