
Today, I would like to return to the discussion of international ETF strategies after focusing mostly on U.S.-centered.
As a quick refresher, the principal problem with international ETFs is that at times they go unloved as they have a reputation of being permanent laggards compared to their U.S.-focused counterparts. However, there are two issues with this underperformance phenomenon. First, it does not immediately imply ex-U.S. portfolios always fail to beat the S&P 500 index. In reality, most perform asymmetrically, allowing to weather storms raging in the U.S. market even enjoying modest gains (at times). Second, weaknesses are mostly inherent to foreign equity portfolios that utilize conventional market cap weighting, while pickier, more sophisticated strategies have a much greater potential to surprise to the upside. For instance, the value factor-centered Pacer Global Cash Cows Dividend ETF (GCOW) eked out an about 5.5% gain last year, while the iShares Core S&P 500 ETF (IVV) was down by 18.2%. The iShares MSCI EAFE ETF (EFA) fared only marginally better than the U.S. bellwether basket, with a negative total return of 14.4%.
The VanEck Morningstar International Moat ETF (BATS:MOTI) is a fund I would like to dissect today. At first blush, it offers a compelling strategy with the quality factor (measured using the concept of an economic moat) at its crux.
Picking little-known non-U.S. stocks (more on that below), MOTI could help investors meet their diversification goals, with FX exposure also being potentially beneficial as the U.S. tightening cycle is probably nearing its end, which pundits may view as overall bullish for the pound sterling, euro, and other currencies influencing MOTI’s returns. Next, expenses are adequate at 58 bps. AUM of $229 million highlights substantial investor interest.
The fund has been tracking the Morningstar Global ex-US Moat Focus Index since its inception in July 2015. The philosophy of the index is mostly similar to the one tracked by the VanEck Morningstar Wide Moat ETF, which I previously covered in February 2022, with the key obvious difference being the selection universe. As detailed in the prospectus, both emerging and developed market equities can compete for a place in it in case they have qualified for the Morningstar Global Markets ex-US index. From that sizeable pool, the index provider selects wide and narrow moat companies (capable of maintaining their competitive advantages for either 20 or 10 years, respectively) that demonstrate attractive valuation characteristics (measured by Morningstar’s equity research team using proprietary screens), also scoring well against momentum indicators. It is worth reading the rulebook for a better understanding of the process.
As of June 16, MOTI had 68 stocks in its portfolio, with the principal ten accounting for 21.6%. They are shown in the table below.
| Number | Original Ticker | ADR | Holding Name | % of Net Assets | EY (IFRS) |
| 1 | AGL AU | (OTCPK:AGLXY) | AGL Energy Ltd | 2.58% | N/A |
| 2 | BMW GR | (OTCPK:BMWYY) | Bayerische Motoren Werke AG | 2.18% | 15.7% |
| 3 | AC FP | (OTCPK:ACCYY) | Accor SA | 2.15% | 3.66% |
| 4 | INGA NA | (ING) | ING Groep NV | 2.14% | 29.85% |
| 5 | CON GR | (OTCPK:CTTAY) | Continental AG | 2.13% | 1.49% |
| 6 | HSBA LN | (HSBC) | HSBC Holdings plc | 2.10% | 14.29% |
| 7 | 9999 HK | (NTES) | NetEase, Inc. | 2.10% | 5.13% |
| 8 | 522 HK | (OTCPK:ASMVY) | ASMPT Ltd | 2.09% | 6.46% |
| 9 | 2330 TT | (TSM) | Taiwan Semiconductor Manufacturing Co Limited | 2.06% | 6.84% |
| 10 | FRE GR | (OTCPK:FSNUY) | Fresenius SE & Co. KGaA | 2.05% | 9.02% |
Created using data from Seeking Alpha and the fund. EYs are shown for American Depositary Receipts. AGL Energy has an LTM IFRS loss, its EY is negative
With 15.62 PJ operated gas storage inventory and 10,330 MW operated generation capacity, AGL Energy is a Tier 1 energy retailer in Australia. As per data from the AER’s Quarterly Retail Performance Report (October – December 2022), the “Tier 1 retailers comprise Origin Energy, AGL and Energy Australia,” and their combined market share was 64.5% in residential electricity and 80.2% in residential gas. Slide 17 of AGL’s investor day presentation also tells us it has #1 market share in commercial solar. Small wonder it qualified for the MOTI portfolio.
A remark worth making here is that valued at ~AU$7.4 billion (~US$5 billion), AGL is too small for the iShares MSCI Australia ETF (EWA), which reveals MOTI’s unobvious advantage as it offers exposure to overseas names U.S. investors would not otherwise access using other simpler ETF products, potentially allowing them to meet diversification goals; it is hardly a coincidence that MOTI’s correlation to the U.S. market is just 0.79 (more on that shortly).
As the data from the fund illustrates, its weighted-average market cap was slightly below $42 billion as of end May. Interestingly, MOTI has an EY (8.9%) even higher compared to the one of the iShares MSCI ACWI ex U.S. ETF (ACWX) that stood at 7.47% (13.38x Price/Earnings) as of June 20, which is most likely the consequence of the valuation screen its underlying index has.
VanEck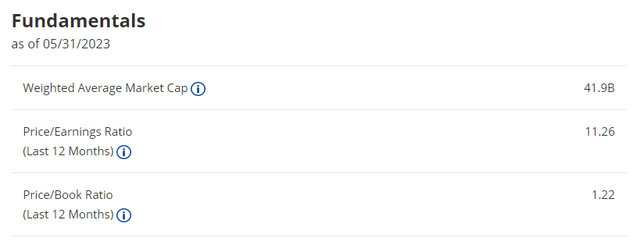
MOTI favors the information technology, healthcare, and consumer discretionary sectors; compared to ACWX, it is significantly underweight in financials and industrials.
Created by author using data from the funds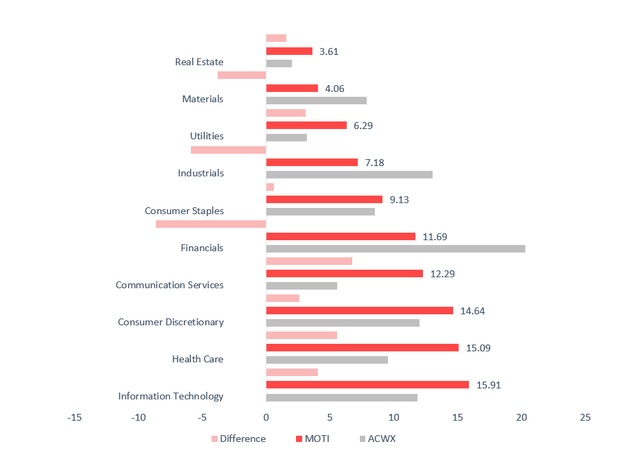
It is of note that no energy companies (e.g., oil & gas exploration & production or OFSE players) managed to qualify for the international moat stock index. On a side note, MOAT has no exposure to the energy sector either.
Regarding countries, the fund is most bullish on China (hence, has large exposure to the Hong Kong dollar), while ACWX is overweight Japan. UK stocks are in second place in both.
| Country | Weight |
| China | 27.42% |
| United Kingdom | 14.92% |
| Germany | 9.46% |
| France | 8.43% |
| Netherlands | 6.91% |
Data from MOTI
| Country | Weight |
| Japan | 14.59% |
| United Kingdom | 9.46% |
| China | 8.41% |
| France | 7.81% |
| Canada | 7.32% |
Data from ACWX
Performance discussion: ex-U.S. moat stocks under-deliver
As the table below illustrates, during the August 2015 – May 2023 period, MOTI beat ACWX only marginally, with a compound annual growth rate 11 bps higher; at the same, it also just slightly underperformed the Vanguard Total International Stock ETF (VXUS), which also ignores U.S. equities tracking the FTSE Global All Cap ex US Index. In the meantime, the iShares Currency Hedged MSCI ACWI ex U.S. ETF (HAWX) bested both ACWX, MOTI, and VXUS, so a hypothesis that currency fluctuations were among the detractors from their performance should be a correct one. Ultimately, none of the ex-U.S. funds had a CAGR close to IVV’s, which also delivered the strongest risk-adjusted returns (Sharpe, Sortino ratios).
|
Portfolio |
MOTI | ACWX | VXUS | HAWX | IVV |
| Initial Balance | $10,000 | $10,000 | $10,000 | $10,000 | $10,000 |
| Final Balance | $13,264 | $13,148 | $13,528 | $15,701 | $22,936 |
| CAGR | 3.67% | 3.56% | 3.93% | 5.93% | 11.18% |
| Stdev | 17.29% | 15.71% | 15.94% | 13.09% | 16.08% |
| Best Year | 30.09% | 27.22% | 27.45% | 22.74% | 31.25% |
| Worst Year | -13.89% | -16.04% | -16.10% | -9.78% | -18.16% |
| Max. Drawdown | -30.13% | -28.31% | -27.76% | -20.42% | -23.93% |
| Sharpe Ratio | 0.22 | 0.22 | 0.25 | 0.41 | 0.67 |
| Sortino Ratio | 0.34 | 0.32 | 0.35 | 0.6 | 1.01 |
| Market Correlation | 0.79 | 0.87 | 0.87 | 0.88 | 1 |
Created by the author using data from Portfolio Visualizer
Still, the advantage to mention is that MOTI had the lowest correlation to the U.S. market in this group.
Delving deeper, MOTI had underperformed IVV every year since its inception, except for 2017 and 2022.
Created by the author using data from Portfolio Visualizer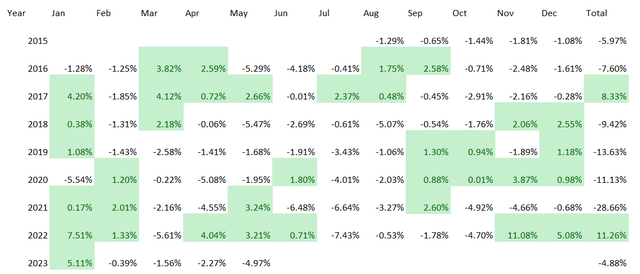
Compared to ACWX, it looks much stronger, but the CAGR delivered over that period was only marginally higher anyway.
Created by the author using data from Portfolio Visualizer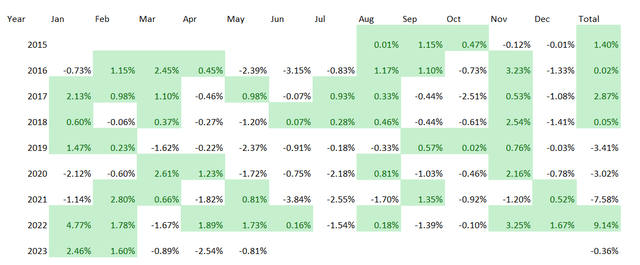
Investor Takeaway
MOTI provides exposure to a basket of non-U.S. large- and medium-size names with robust competitive advantages. At first glance, it has an investment strategy capable of delivering sustainable long-term alpha. But the total returns since its inception suggest otherwise.
In reality, ex-U.S. moaty stocks systematically under-deliver. A hypothesis could be constructed that MOTI’s inability to catch up with IVV is mostly the consequence of small tech exposure it had in the past. However, this ETF was incapable of meaningfully outperforming even ACWX, which ignores the U.S. market entirely, and has a modest allocation to international tech plays, being influenced principally by old-economy stocks like banks, insurance companies, and industrials. Overall, I am unimpressed by MOTI’s track record, and I view a rating above Hold as unjustified.
Read the full article here

