
Oxford Lane Capital (NASDAQ:OXLC) recently unveiled a detailed analysis of its financial health. The firm observed a slight decline in its Net Asset Value (NAV) per share over a recent period. OXLC’s income indicators, including its Net Investment Income (NII) and the more transparent Core NII, which reflects cash outflows from its collateralized loan obligation (CLO) equity assets, stood out as significant highlights. This article delves into the technical analysis of OXLC to discern the potential trajectory of its stock price and identify investment prospects. The analysis indicates that the stock price manifests a robust bullish trend, suggesting potential for continued growth.
Financial Performance
OXLC provided a comprehensive review of its financial health in its most recent announcement. Starting with NAV, the company noted a per-share value of $4.34 as of June 30, 2023, a slight decrease from $4.61 per share on March 31, 2023.
Regarding income metrics, OXLC reported an NII of approximately $42.0 million, which translates to $0.24 per share for the three months ending June 30, 2023. Moreover, its Core NII—a metric that offers clarity by considering additional cash outputs from CLO equity assets—stood at about $75.0 million or $0.43 per share in the same period. This represents a significant part of the company’s revenue. Its total investment income also experienced growth, amounting to roughly $70.5 million, an increase of about $4.0 million from the previous quarter. A significant chunk, around $66.2 million, came from CLO equity and CLO warehouse assets.
Meanwhile, earnings from CLO debt assets and other income sources were minimal, at $4.3 million. Expense-wise, OXLC trimmed operational costs. The quarter’s total outlays were around $28.5 million, down from almost $29.0 million in the previous quarter.
Yield metrics offered insights into OXLC’s financial position. By June 2023, the average yield of CLO debt assets at current cost had risen to 18.1% from 18.0% at the close of March 2023. At the same time, the average effective yield of CLO equity assets at current cost went up to 16.0% from 15.8% in March 2023. There was a significant increase in the average cash yield of CLO equity assets at the current rate, jumping to 24.6% from 16.5%. However, OXLC reported a net asset decline from operations of roughly $14.8 million or $0.08 per share. This encompassed the mentioned NII of $42.0 million, realized losses close to $1.3 million, and a significant unrealized depreciation of around $55.5 million.
For the investment activities, OXLC disbursed nearly $111.9 million within the quarter and gained about $69.7 million from CLO investment sales and repayments. The company introduced roughly 12.1 million common stock shares regarding capital raising, resulting in approximately $60.2 million in net proceeds after costs. This augmented the NAV per share by an estimated $0.03 for the mentioned period. As of June 2023, the total common stock tally was about 185.3 million shares.
A Deep Dive into Bullish Price Patterns
The OXLC technical chart suggests a robust bullish trend, as evidenced by the monthly chart below. The stock price has formed an ascending broadening wedge pattern since its $1.63 low in 2011, peaking at $6.56 in 2022. Notably, this formation has significant price volatility, but the broader market sentiment remains predominantly bullish. The steepest declines for OXLC occurred in 2016 and 2020, touching lows of $1.48 and $1.06, respectively. However, substantial rallies promptly countered both declines, finding support within the wedge pattern. Notably, these downturns coincided with the RSI’s oversold zones, marked by blue arrows.
OXLC Monthly Chart (stockcharts.com)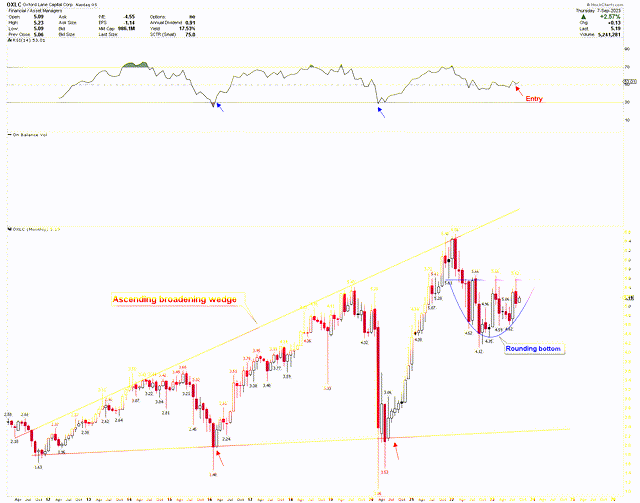
A significant surge in OXLC’s stock price post-2016 is attributed to several factors. During this timeframe, investors heavily favored assets that generated yields. OXLC’s stakes in CLO equity tranches were particularly enticing due to their higher yields in a low-interest-rate backdrop. The company’s effective portfolio management translated to impressive quarterly outcomes, consistently matching or surpassing market forecasts. This mix of macroeconomic drivers, a collective investor hunt for yield, and OXLC’s robust operational execution amplified the bullish vibes surrounding the stock.
Moreover, the 2020 bounce-back aligned with the overall market recovery post the initial jolt of the COVID-19 pandemic. Many stocks surged as investors scouted for promising investments catalyzed by low-interest rates and unmatched monetary stimulus. The sharp uptick in 2020 and 2021 is attributed to heightened yield demand and favorable shifts in the CLO market dynamics. Interestingly, 2022 witnessed a potential “rounding bottom” in the stock’s price, hinting at a bottoming out and probable future appreciation. The RSI has now surpassed its mid-point of 50, coupled with the stock price’s uptick, suggesting further gains for OXLC.
Key Action for Investors
Delving deeper into OXLC’s pronounced bullishness, the weekly chart below unveils an inverted head and shoulders pattern, with a neckline pegged at $5.70. This pattern is marked by a head at $4.12 and shoulders at $4.52 and $4.59. The head showcases a double bottom at $4.12 and $4.35. The pattern’s bullish essence originates from the 2020 low, which also exhibited a double bottom. This price movement implies a potential upward trajectory contingent on a breakout above the $5.70 neckline. The latest weekly candlestick was a reversal, bottoming at $4.97, showcasing the market’s vigor. The RSI is on an uptrend from its 50 midpoints.
OXLC Weekly Chart (stockcharts.com)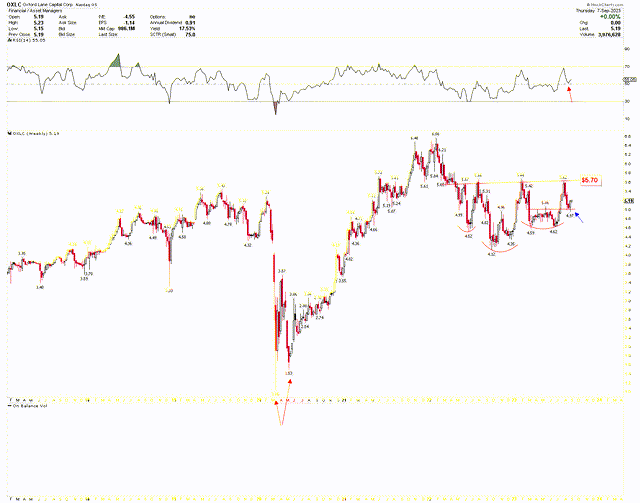
Further emphasizing the bullish stance, OXLC’s short-term perspective mirrors the optimistic outlook. The pattern’s right shoulder showcases a double bottom at $4.591 and $4.616, which has also been surpassed. A pullback to the breakout points at $4.97 presents an enticing entry point for long-term investors. Since the stock price has reached this point and is trending upward, investors may consider buying at this mark and increasing holdings if the stock price descends further.
OXLC Daily Chart (stockcharts.com)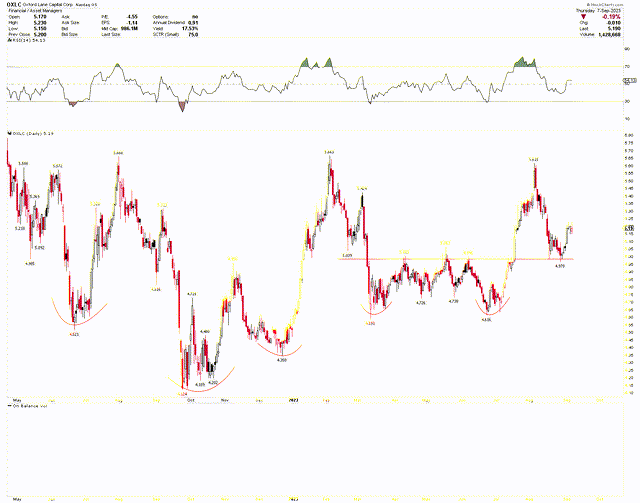
Market Risk
Despite the rise in total investment income and a significant portion of revenue derived from CLO equity and warehouse assets, the company experienced decreased NAV per share. Additionally, the firm noted a considerable net asset decline from operations, potentially impacting views on its financial health.
The firm’s dedication to enhancing shareholder value shines through its dividend declarations and robust investments. Yet, significant alterations in these dividends or an inability to sustain them could undermine investor trust.
While the OXLC technical chart presents an optimistic trend backed by various patterns, an ascending broadening wedge suggests intense price volatility, signaling the potential for sharp moves in any direction. Should the price dip below $4, it could negate the optimistic inverted head and shoulders pattern, triggering a pronounced decline in OXLC.
Bottom Line
OXLC’s financial performance and position in the market offer a multi-faceted picture. The total investment income and Core NII showcase promising growth, and the company’s dedication to shareholders is clear from their consistent dividend announcements and investment activities. The technical outlook for the stock is undeniably bullish, suggesting potential for future appreciation.
The appearance of a rounding bottom in the monthly chart suggests the price might fulfill the ascending broadening wedge pattern by approaching the wedge’s upper trend line. Furthermore, the inverted head and shoulders in the weekly chart and the double bottom in the daily chart underscore bullish price tendencies. The price breach of $5.70 could trigger a robust upward rally. Investors may consider buying OXLC at its current price and accumulate holdings if the stock price adjusts downward.
Read the full article here

