
Invesco Raymond James SB-1 Equity ETF (NYSEARCA:RYJ) is a quasi-actively managed investment vehicle that I attempt to cover at least once every few months. As I clarified in the previous note, I apply the ‘quasi-active’ label when describing exchange-traded funds that are, at first glance, managed passively, but with overly sophisticated underlying indices, at times involving analysts’ opinions on certain companies, and frequent reconstitution and rebalancing translating into triple-digit turnovers (i.e., RYJ’s turnover is at 104%),
To recap, as described on its website, RYJ tracks the Raymond James SB-1 Equity Index, which:
…is comprised of US-listed equity securities rated Strong Buy 1 by Raymond James & Associates, Inc. The Fund and the Index are rebalanced semi-monthly.
In other words, the RYJ portfolio is essentially a basket of high-conviction picks from Raymond James, reshuffled twice a month.
The Current State Of The RYJ Portfolio: Slight Sector Exposure Drifts, Quality And Value Deteriorated Further
Since my previous note published in May, as comes from the ticker comparison, 14 holdings were removed (about 8% weight) and 27 holdings, accounting for 14.7% as of September 1, were added. Among the most notable removals were Toll Brothers (TOL), Tidewater (TDW), and IPG Photonics (IPGP). The most significant newcomers were Palantir (PLTR), New Relic (NEWR), and NBT Bancorp (NBTB), accounting for 90 bps, 60 bps, and 59 bps, respectively.
These changes resulted in a slight sector exposure drift as shown below; for instance, energy gained about 2.5%, while consumer discretionary lost 2.2%.
| Sector | September | May | Difference |
| Communication Services | 4.0% | 4.4% | -0.4% |
| Consumer Discretionary | 7.6% | 9.8% | -2.2% |
| Consumer Staples | 2.2% | 1.7% | 0.5% |
| Energy | 15.3% | 12.8% | 2.5% |
| Financials | 19.8% | 19.3% | 0.5% |
| Health Care | 14.1% | 12.5% | 1.6% |
| Industrials | 13.0% | 13.9% | -1.0% |
| Information Technology | 12.7% | 13.7% | -0.9% |
| Materials | 1.2% | 1.2% | 0.0% |
| Real Estate | 9.4% | 10.1% | -0.7% |
| Utilities | 0.6% | 0.6% | 0.0% |
Created using data from the RYJ website
Interestingly, what has almost not changed is the fund’s slight tilt towards biotechnology companies (reflected in the healthcare allocation of over 14%). This, in turn, is a meaningful detractor from its quality profile. We will return to that issue shortly.
The following table presents the factors that are currently most significantly influencing my rating on RYJ. And alas, I see no reason for an upgrade from what is shown below.
| Metric | 24-May | 1-Sep | Change |
| Market Cap | $26.4 billion | $30.6 billion | $4.35 billion |
| EY | 1.89% | 1.64% | -0.25% |
| EPS Fwd | 15.74% | 10.80% | -4.94% |
| Revenue Fwd | 13.95% | 14.46% | 0.52% |
| ROE | 8.86% | 5.75% | -3.11% |
| ROA | -0.19% | -3.75% | -3.56% |
| P/S | 10.61 | 12.57 | 1.96 |
| Quant Valuation: B- or higher | 26.9% | 23.0% | -3.9% |
| Quant Valuation: D+ or worse | 45.7% | 43.3% | -2.4% |
| Quant Profitability: B- or higher | 61.0% | 57.4% | -3.6% |
| Quant Profitability: D+ or worse | 12.0% | 15.5% | 3.5% |
Factor exposure comparison. Data as of September 4. Computed by the author using data from Seeking Alpha and the fund
In fact, we see the weighted-average market capitalization rising, but with a compression in the earnings yield as a side effect. My dear readers who have been following my research recently are more likely to remember that I have been arguing against buying into low-EY stories or, more broadly speaking, into portfolios with flawed valuations. Bulls would riposte here that the recent economic data pointing to the stress the labor market is already feeling amid tighter credit conditions bodes well for long-duration equities. However, I personally do not see enough evidence for that. To corroborate, FX traders en masse perhaps share a similar view, and do not buy into the story that the Fed will cut interest rates soon while the rest of the developed world will continue increasing borrowing costs. A good illustration is the performance of the Invesco DB US Dollar Index Bullish Fund (UUP), which describes itself as:
designed for investors who want a cost effective and convenient way to track the value of the U.S. dollar relative to a basket of the six major world currencies – the euro, Japanese yen, British pound, Canadian dollar, Swedish krona and Swiss franc.
The latest nonfarm payrolls report was published on September 1, with unemployment at 3.8% vs. a 3.5% consensus estimate. This could be interpreted as a sign of the economy slackening. Hence, potentially no more interest rate increases, which should reduce the allure of the dollar. But UUP has risen by 1.35% since August 31 nonetheless.
Seeking Alpha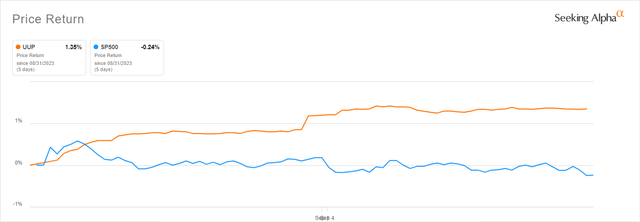
However, the EY is not the most reliable value indicator, and in the case of RYJ, it is more of a quality indicator (i.e., reflecting the 27.7% share of loss-making companies). But thankfully, we have the Quant Valuation grades, which provide a thorough view. And the issue is that, again, they are showing the RYJ portfolio as mostly overvalued, with 57.4% of the holdings D+ rated or worse.
Next, from RYJ’s current portfolio structure, it can be deduced that the fund remains a huge believer in small- and mid-cap growth phenomena, as about 64% of the net assets are allocated to companies valued at less than $10 billion. These echelons have historically been associated with outsized capital appreciation potential. So, it is completely rational to look for opportunities in the small/mid-cap universe. The issue that I have already described in the previous note is that it is problematic to balance quality when it comes to smaller companies. In certain cases, profitability is sacrificed. So investors who are considering RYJ now should understand that compromises must be made, and if they are not content with the fund’s negative weighted-average return on assets and single-digit return on equity, it is worth passing on it. Regarding ROA, it is true that Zura Bio (ZURA) is the key detractor with its negative 533.6% metric, but even with its impact removed, the WA figure would still be below zero.
And finally, growth characteristics became weaker, with the forward EPS growth rate falling meaningfully and the revenue growth rate going up just marginally.
Performance Update
I should admit that RYJ has been surprised by the upside since the May note. However, this changes little regarding my longer-term skeptical view.
Seeking Alpha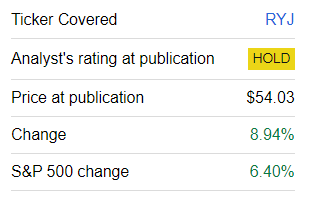
And the following screenshot showing its performance since the first analysis published on March 5 partly explains why.
Seeking Alpha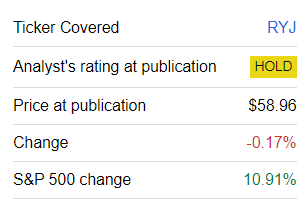
Overall, historically, RYJ has not been a consistent outperformer. More specifically, the $10,000 invested in the ETF was certainly growing, but at a much slower pace compared to the same amount deployed to the iShares Core S&P 500 ETF (IVV) or the SPDR S&P MidCap 400 ETF Trust (MDY). To corroborate, below is the comparison of total returns delivered by IVV, RYJ, and MDY over the October 2008 – August 2023 period. RYJ was incepted in May 2006, and the period was shortened intentionally as “the Guggenheim predecessor fund acquired the Claymore/Raymond James SB-1 Equity Fund” in September 2008, as mentioned in the fact sheet.
| Portfolio | IVV | RYJ | MDY |
| Initial Balance | $10,000 | $10,000 | $10,000 |
| Final Balance | $51,776 | $42,552 | $43,998 |
| CAGR | 11.65% | 10.20% | 10.44% |
| Stdev | 15.97% | 22.19% | 19.04% |
| Best Year | 32.30% | 56.34% | 37.58% |
| Worst Year | -22.10% | -28.41% | -25.85% |
| Max. Drawdown | -35.99% | -40.79% | -37.33% |
| Sharpe Ratio | 0.73 | 0.52 | 0.58 |
| Sortino Ratio | 1.09 | 0.76 | 0.85 |
| Market Correlation | 1 | 0.92 | 0.96 |
Created using data from Portfolio Visualizer
Investor Takeaway
In sum, RYJ is a passively managed fund with an active ingredient beneath the surface. RYJ comes with a fairly hefty total expense ratio of 81 bps and a triple-digit turnover.
Invesco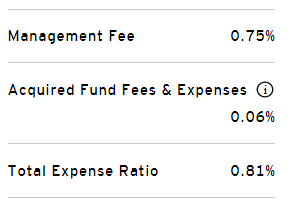
Stocks that have been added since the previous coverage in May now account for almost 15% of the portfolio. Factor exposure has mostly deteriorated, including on the valuation, quality, and even growth fronts. The fund has surprised to the upside in the summer, which still changes nothing fundamentally about my overall skepticism. The Hold rating is maintained.
Read the full article here

