
Investment Thesis
My experience as a Seeking Alpha analyst has been overwhelmingly positive. I’ve refined my writing and investment approach over the last three years and built an extensive database to help identify the best ETFs. Still, great ideas often come from readers and other analysts, including this one from my colleague at the Hoya Capital Income Builder, ETF Monkey. So today, I’d like to offer my take on holding just two low-cost ETFs from Schwab and calling it a day. They would be the Schwab U.S. Large-Cap Growth ETF (NYSEARCA:SCHG) for growth and the Schwab U.S. Dividend Equity ETF (NYSEARCA:SCHD) for value and dividends. This article tests that strategy by evaluating its fundamentals and historical returns (in various combinations) against the SPDR S&P 500 ETF (SPY). I hope you enjoy the read.
Key Advantage: Low Overlap
Investment objectives differ for everyone, but I assume the goal is to improve the returns, possibly risk-adjusted returns, compared to SPY. The first advantage of this strategy is that it’s very easy to overweight or underweight a particular factor. For example, if you’re confident in value stocks for one year, buy SCHD. Or, if markets signal favoritism toward growth stocks, buy SCHG. Either way, your capital is efficiently deployed because the two ETFs have almost no overlap. The ETF Research Center puts it at just 3%.
The reason for the low overlap, and why it should continue, is because of screening criteria differences. SCHG tracks the Dow Jones U.S. Large-Cap Growth Total Stock Market Index, weighting stocks by float-adjusted market capitalization. Selections are based on factors including:
- Forward Price-Earnings Ratio
- Estimated 3-5Y Operating Earnings Growth
- Trailing Price-Book Ratio
- Indicated Dividend Yield
- Trailing 5Y Revenue Growth
- Trailing 21Q EPS Growth
On the other hand, SCHD tracks the Dow Jones U.S. Dividend 100 Index, selecting 100 U.S. securities (excluding REITs) that have paid a dividend for ten consecutive years according to four criteria:
- Free Cash Flow To Total Debt
- Return on Equity
- Indicated Dividend Yield
- Average 5Y Dividend Growth Rate
Notice how the only common screen is indicated dividend yield. However, SCHD’s Index screens out the bottom 50% of securities by yield even before calculating the four metrics above. This step is crucial, giving SCHD an immediate value and yield edge. The other criteria support quality (profitability) and dividend growth. In short, SCHG and SCHD have almost no overlap because their screens have virtually no overlap. Therefore, they’re perfect complements. However, that’s different than being an optimal choice, so first, let’s evaluate how a portfolio of the two in various allocations would have performed since SCHD launched in October 2011.
Performance: SCHG/SCHD Equal Weight
The following performance chart provides risk and return metrics for three portfolios, linked here. The first is a 60/40 mix favoring SCHG. The second is an equal-weight portfolio, and the third is a 60/40 mix favoring SCHD. All charts assume reinvested dividends and annual rebalancings.
Portfolio Visualizer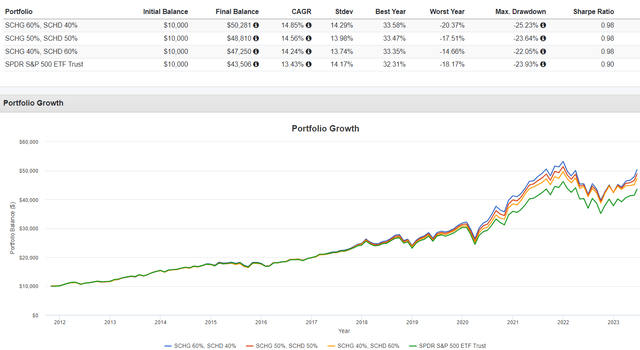
I’m impressed that all three portfolios outperformed SPY on total and risk-adjusted returns (Sharpe and Sortino Ratios). I assume this was part of the rationale for this 2-ETF solution. It’s no secret that SCHD has struggled this year, while SCHG struggled last year. However, that’s precisely the point. This solution targets two contrasting styles, so hopefully, one will be up when the other is down.
Portfolio Visualizer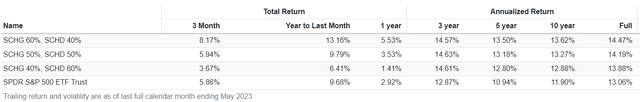
My only criticism so far is that this approach may result in something too similar to SPY. In a way, you’re destined to only match market returns, with the possibility of slightly outperforming in some years. To illustrate, the median beat for the 50/50 portfolio over SPY from 2012-2022 was 0.43%. The average beat was 1.21%, but that figure is skewed by an 8.74% win in 2020 that is unlikely to repeat. Still, it’s better than nothing, and it’s tough to put a price on the added flexibility this approach provides.
All three provided remarkable growth in dividends, and investors would wind up with a solid 7.16% yield on cost with reinvested dividends at minimum in the ten years between 2012-2022. The 60/40, 50/50, and 40/60 portfolios below translate to annualized 13.70%, 14.47%, and 15.02% growth rates.
Portfolio Visualizer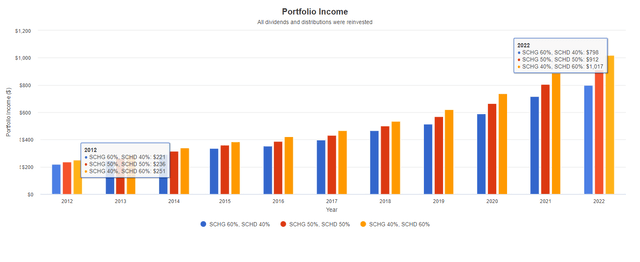
All are exceptional, primarily because both ETFs have great quality screens. Fast dividend growth happens when you hold only highly-profitable stocks, so if you want to simplify your investment approach, start with that metric.
Fundamental Analysis
SCHG By Company
The following table highlights selected fundamental metrics for SCHG’s top 25 companies, which total 72% of the fund. I’ve also included summary metrics for SPY for comparison purposes.
The Sunday Investor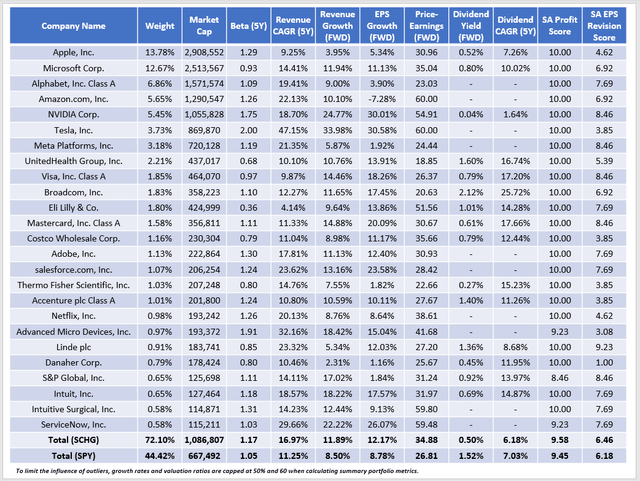
SCHG is a highly concentrated portfolio. However, that matters less since we know we’ll combine it with SCHD in some capacity. As expected, SCHG has better growth features, including five-year historical sales growth (16.97% vs. 11.25%), one-year estimated sales growth (11.89% vs. 8.50%), and one-year estimated EPS growth (12.17% vs. 8.78%). Many top holdings either don’t pay a dividend or only pay a negligible one, so the portfolio’s gross yield is 1.02% less than SPY (0.50% vs. 1.52%). And its five-year dividend growth rate is also about 1% less. However, it’s probably sustainable. SCHG has a 9.58/10 Profitability Score, calculated from individual Seeking Alpha Factor Grades. Advanced Micro Devices (AMD), S&P Global (SPGI), and ServiceNow (NOW) are the only three top holdings without a perfect Profitability Grade.
My main criticism of SCHG is its high 34.88x forward earnings valuation, eight points more than SPY. Again, we’re combining it with SCHD, so this will be offset. However, SCHG is consistently among the most expensive large-cap growth ETFs I cover. In this article, I demonstrated how VUG, SPYG, IWF, and QQQ were cheaper options and how SPYG and IWF had better growth and valuation combinations. Therefore, I’m not convinced SCHG is the best option. To illustrate, consider SCHG’s annual rankings from 2010-2023 against 15 other large-cap growth ETFs with at least the same track record.
The Sunday Investor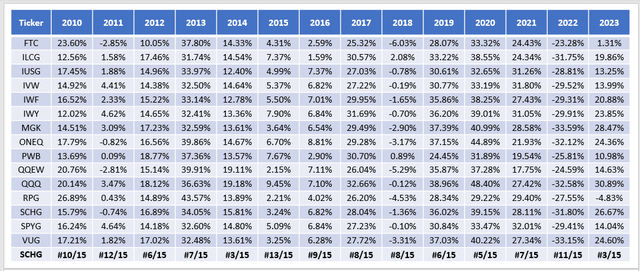
As shown, SCHG is mostly a middle-of-the-pack fund. Its average annual ranking was 7.71/15, or sixth-best in the sample. The ETFs with better average annual rankings were:
- Invesco QQQ ETF (QQQ): 3.71/15
- Fidelity Nasdaq Composite Index ETF (ONEQ): 6.57/15
- iShares Russell Top 200 Growth ETF (IWY): 7.36/15
- SPDR Portfolio S&P 500 Growth ETF (SPYG): 7.36/15
- iShares Russell 1000 Growth ETF (IWF): 7.64/15
Compounded returns confirm these results. Here’s how SCHG compared against the five since January 2010. I added the Vanguard Mega Cap Growth ETF (MGK) since its compounded returns slightly edged SCHG.
Seeking Alpha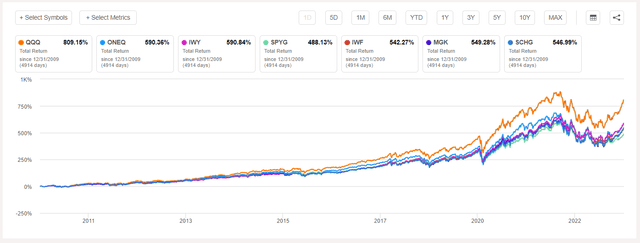
Finally, these six alternatives have between 3% and 12% overlap with SCHD, so SCHG isn’t necessarily unique. Simply put, other large-cap growth ETFs may be better for passive investors.
SCHD By Company
The following table highlights the same metrics for SCHD’s top 25 holdings, totaling 79% of the fund. The first thing to note is the much smaller weighted average market capitalization: $148 billion vs. SCHG’s $1.09 trillion. Also, SCHD places a 4% cap on its holdings with each rebalancing. Recall SCHG was much more concentrated, with one-quarter allocated to Apple (AAPL) and Microsoft (MSFT).
The Sunday Investor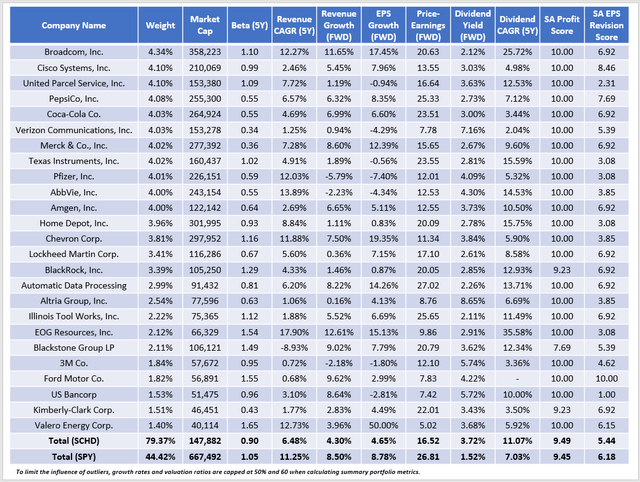
Most metrics differ, which is why SCHD is an effective complement. Its 0.90 five-year beta suggests a less volatile portfolio, hopefully providing downside protection. Historical sales growth is about 5% less than SPY, and one-year estimated sales and earnings growth is 4% weaker. We also see a solid discount on forward earnings (16.52x vs. 26.81x) and a 3.72% gross dividend yield that should satisfy the value side of the strategy.
One positive is SCHD’s strong 9.49/10 Profitability Score. It’s one of SCHD’s best and most consistent features. The holdings might change, but as long as I’ve been covering SCHD, profitability remained high, and it’s because of its Index’s free cash flow to total debt and return on equity screens. SCHD’s constituents also have an 11.07% five-year dividend growth rate, close to what the ETF itself delivered, and high profitability is a crucial reason. The downside, at least currently, is that SCHD’s earnings growth rates do not support this level of dividend growth. I also think it’s why SCHD has struggled in this year’s bull market.
Finally, SCHD’s 5.44/10 EPS Revision Score underscores Wall Street’s negative sentiment toward high-dividend stocks. To support this number, consider how SCHD’s weighted average sales and earnings surprises were just 1.35% and 6.15%. In contrast, SCHG’s figures were 2.89% and 10.27%. In short, while some argue that this bull market is unjustified, the evidence suggests it’s only partially accurate. Growth stocks delivered better results last quarter, and Wall Street responded in kind. While there’s an argument to be made that the rally has gone too far, I don’t expect SCHG’ s outperformance to reverse entirely.
SCHG & SCHD: 50/50 Sector Exposures
The final step is to combine all of this information to determine if this simplified strategy has merit. But first, here is a snapshot by sector to let you know what you could invest in today.
The Sunday Investor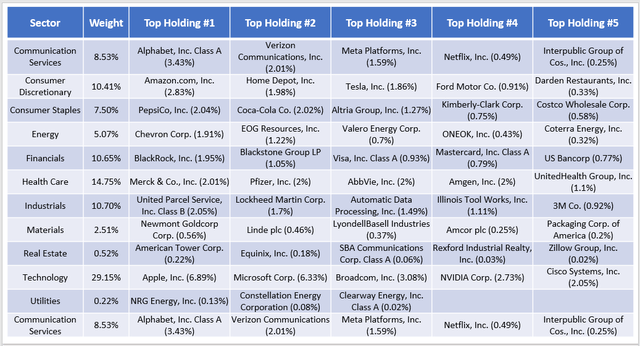
These allocations are almost identical to SPY, with the most significant differences being an overweighting of Industrials (2.31%), Health Care (1.27%), and Energy (1.04%). As offsets, the 50/50 portfolio underweights Utilities (2.41%), Real Estate (1.86%), and Financials (1.76%). The remaining five sectors have less than a 1% allocation difference.
On a company level, there are some noteworthy differences. Broadcom (AVGO), United Parcel Service (UPS), BlackRock (BLK), Amgen (AMGN), Verizon Communications (VZ), and Texas Instruments (TXN) are all overweight by more than 1.50%. Missing are Berkshire Hathaway (BRK.B), Johnson & Johnson (JNJ), JPMorgan Chase (JPM), Exxon Mobil (XOM), Procter & Gamble (PG), Walmart (WMT), and McDonald’s (MCD).
SCHG & SCHD: 50/50 Fundamentals By Company
Finally, the table below highlights the fundamentals for the 50/50 split portfolio. I’ve also included summary metrics for the 60/40 and 40/60 portfolios in the bottom rows.
The Sunday Investor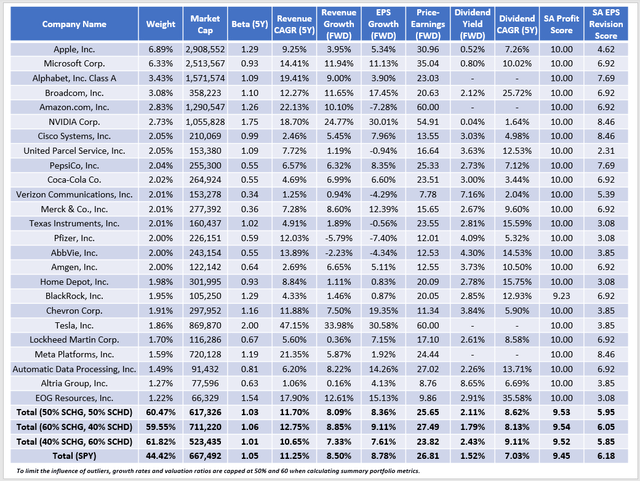
The 50/50 combination reveals a lot of similarities with SPY. In its current state, the 50/50 portfolio has these features:
- 16% more concentrated in its top 25 holdings
- $50 billion lower weighted average market capitalization ($617 billion vs. $667 billion), potentially beneficial if mega-caps pull back.
- 0.55% better historical sales growth but 0.40% lower estimated sales and earnings growth
- 1.16-point lower forward earnings valuation (25.65x vs. 26.81x)
- 0.59% higher dividend yield and better historical dividend growth
- similar Profitability Score (9.53/10 vs. 9.45/10)
- a weaker EPS Revision Score (5.95/10 vs. 6.18/10), suggesting Wall Street still prefers SPY
It’s tough to say which one is better. For me, the best find was the higher 0.59% dividend yield. Otherwise, followers of this strategy give up a fair bit of diversification for a lower growth profile and the flexibility to appropriately weigh the growth and value factors. If that’s your intention, then it works. However, if you plan on using the 50/50 combination indefinitely, I’m not sure it’ll be better than SPY moving forward.
What About QQQ Instead of SCHG?
Recall how QQQ has been the top-performing large-cap growth ETF since 2010. Let’s see how substituting SCHG for QQQ changes the portfolio.
The Sunday Investor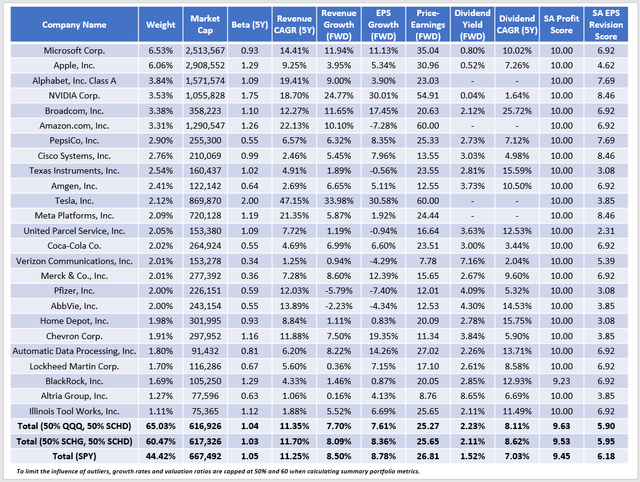
A few things happened, and most were negative. First, adding QQQ made the portfolio even less diversified, with 65% of assets in the top 25. Second, historical and estimated growth rates declined, with the portfolio behind SCHG/SCHD by 0.75% on earnings without much of an improvement in valuation. The main positive was an improvement in yield and profitability, but it was negligible.
I ask readers to place some importance on these fundamentals rather than relying solely on backtested results. Pair QQQ with any value ETF, including SCHD, and Portfolio Visualizer will suggest you can improve returns without taking on extra risk. However, it’s all in hindsight. Remember that QQQ ranked just #13/15 last year because market sentiment was relatively poor, and its growth/valuation combination was inferior to SPY. Market sentiment turned positive this year with improved earnings revision scores and a solid quarter of earnings surprises. Of course, there’s no guarantee history will repeat itself, so we should take backtested results with a grain of salt.
Investment Recommendation
I evaluated the SCHG/SCHD combination to see if it could replace SPY in your portfolio. One advantage is flexibility, as these ETFs have virtually no overlap, and you can easily tilt your portfolio toward growth or value/dividends as market conditions change. Backtested returns were slightly better, and my fundamental analysis revealed many similarities with SPY. The 50/50 portfolio’s Profitability Score is excellent at 9.53/10, provides a 0.59% dividend yield boost, and has a slightly lower growth profile that may benefit if the current bull market halts. The disadvantage is that you lose some diversification benefits: an additional 16% of assets are in the portfolio’s top 25 holdings. Furthermore, Wall Street is slightly less bullish on its constituents.
I also considered QQQ in place of SCHG but was less impressed. The growth/valuation combination deteriorated, and it sacrificed more diversification. Still, I hope this analysis sheds some light on how you can simplify your portfolio using ETFs with little overlap. Please let me know what combination you prefer or are curious about, and I look forward to continuing the discussion in the comments section below. Thank you for reading.
Read the full article here

