
The good news is that we are almost out of September, the worst month of the year for equities!
The bad news is that we now enter the last week of September, the worst week of the year for equities.
Nautilus Optuma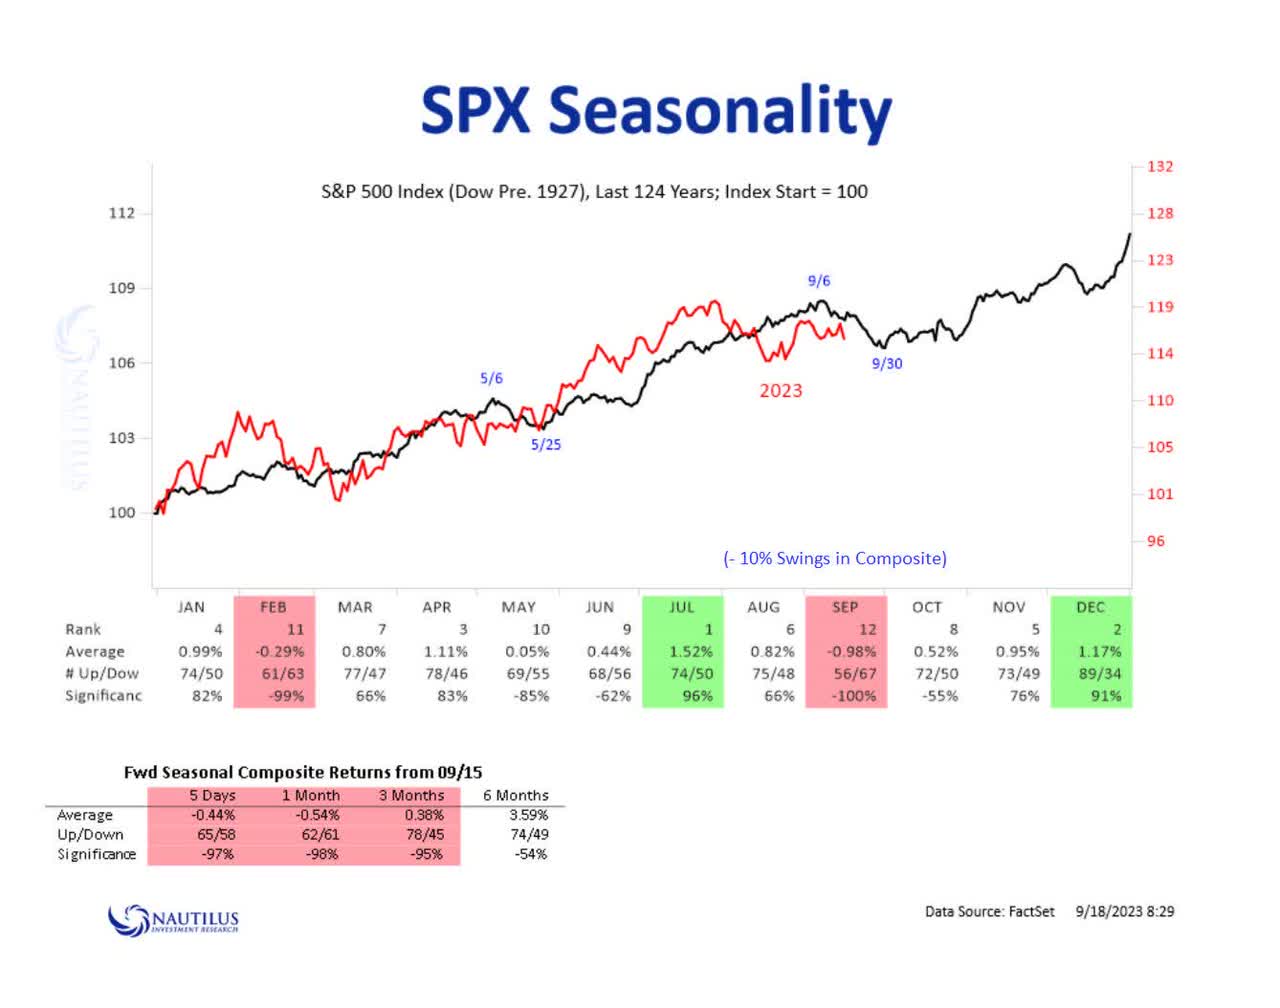
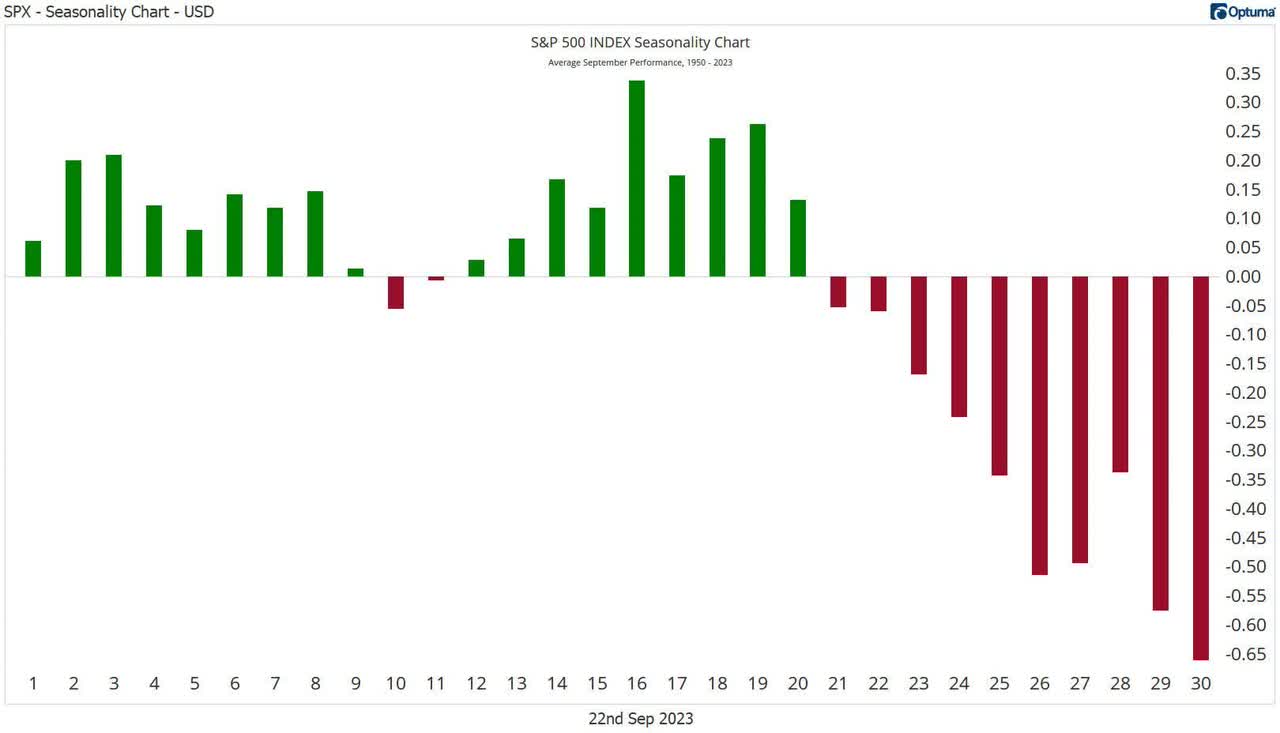
So far this year, the S&P 500 has played out pretty much in line with its seasonal trend, so it is definitely noteworthy to enter the final week of September with caution.
US equity indices tend to put in a near-term bottom sometime around the second week of October, before closing out the year on a strong note.
We can see the fragility in the markets on various macro charts.
The markets are currently spooked out by rising bond yields, with central banks still erring on the hawkish side with regards to fighting inflation.
As such, unless the charts of bond yields and the USD show signs of topping out, risk sentiment is likely to remain in the danger zone. However, on the weekly charts, the dollar index and the US 10-year yield remain on strong uptrends. Not the time to throw caution to the wind yet.
Weekly Chart: Dollar Index
TradingView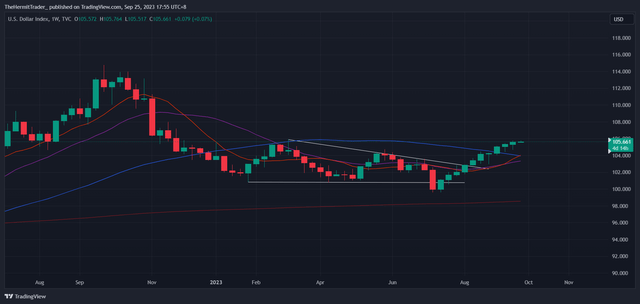
Weekly Chart: US10Y Yield
TradingView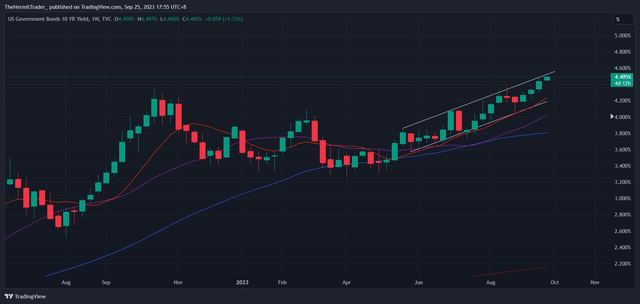
Macro risk proxies are also vulnerable on the charts.
Bitcoin was rejected at the 31k resistance, and now looks to be drooping lower.
Weekly Chart: Bitcoin
TradingView
The Aussie may have been range bound against the USD for a month, but still remains on a downtrend, with price below its 10-week moving average.
Weekly Chart: AUD/USD
TradingView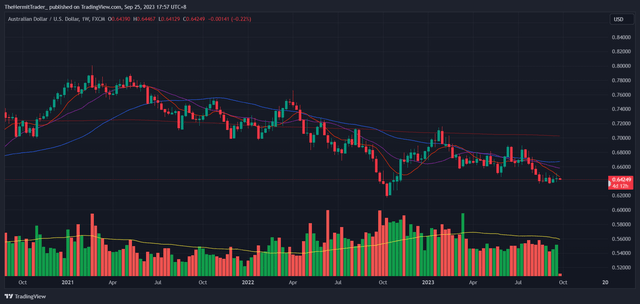
It is therefore not entirely surprising that the S&P 500 (SPY) is also reflecting a lot of this macro weakness on its weekly chart, breaking below its 10 and 20-week moving averages. More reliable supports should be around 413-415, which coincides with its 200-day moving average.
Weekly Chart: SPY
TradingView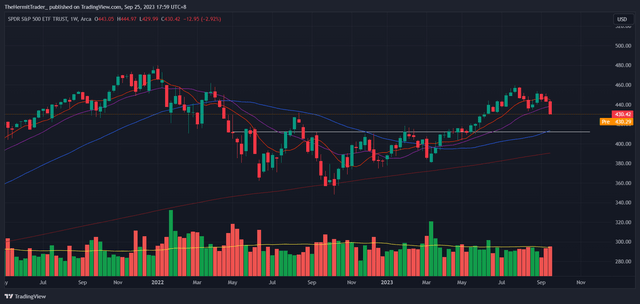
Similarly, the Nasdaq 100 (QQQ) looks to have put in a mini double top, breaking below its 10 and 20-week moving averages. More reliable supports should be closer to 330.
Weekly Chart: QQQ
TradingView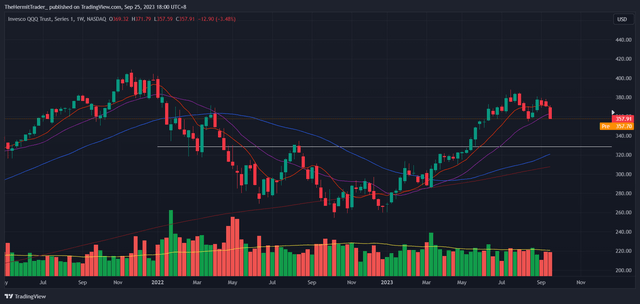
This is not a prediction that the SPY and QQQ will drop to those levels. I am merely noting that if price gets there, and responds favourably there, then I will be a buyer.
I am also open to the markets reversing higher quickly and suddenly above those support levels, which is possible given the amount of negativity out there. A session which opens deep red but closes robustly green would be a good tell that the markets have put in a near-term bottom. In this case, I would be a buyer regardless whether price is near structural supports or not.
The two sectors that I am seeing a lot of strength in are uranium and oil & gas. I have written extensively on uranium and oil & gas weeks ago when they were showing early signs of breaking out.
Uranium (URA) is out from a big base, and is leading the equity markets.
Weekly Chart: URA
TradingView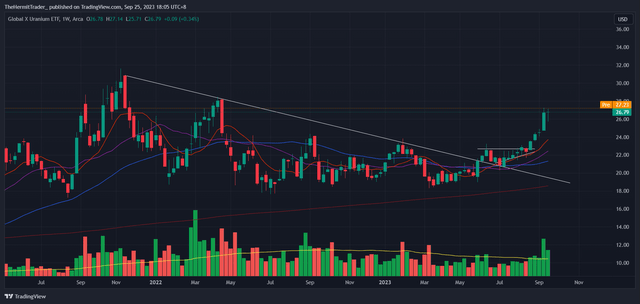
Oil Services ETF (OIH) is holding up very well after breaking out higher from its multi-month base. It is now testing its 10-week moving average.
Weekly Chart: OIH
TradingView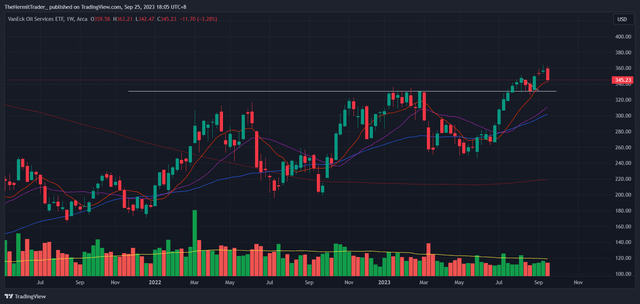
To summarise my views on the market,
- September has been a tough month for stocks, especially during its final week.
- Many macro charts are flashing danger signs for risk sentiment. Coupled with the weak seasonality, it is prudent to wait on the sidelines instead of rushing in to buy too quickly.
- Uranium and oil & gas are the two sectors that are holding up very well in the equity markets. If you need to be a buyer, then focus on these two sectors currently.
Read the full article here

