By using this site, you agree to the Privacy Policy and Terms of Use.
Accept
IndebtaIndebta
  • Home
  • News
  • Banking
  • Credit Cards
  • Loans
  • Mortgage
  • Investing
  • Markets
    • Stocks
    • Commodities
    • Crypto
    • Forex
  • Videos
  • More
    • Finance
    • Dept Management
    • Small Business
Notification Show More
Aa
IndebtaIndebta
Aa
  • Banking
  • Credit Cards
  • Loans
  • Dept Management
  • Mortgage
  • Markets
  • Investing
  • Small Business
  • Videos
  • Home
  • News
  • Banking
  • Credit Cards
  • Loans
  • Mortgage
  • Investing
  • Markets
    • Stocks
    • Commodities
    • Crypto
    • Forex
  • Videos
  • More
    • Finance
    • Dept Management
    • Small Business
Follow US
Indebta > News > S&P 500 Decline Below 200-Day Moving Average Not Even An Outlier
News

S&P 500 Decline Below 200-Day Moving Average Not Even An Outlier

News Room
Last updated: 2023/10/24 at 9:08 AM
By News Room
Share
3 Min Read
SHARE

After the trajectory of the S&P 500 (Index: SPX) dropped below both the dividend futures-based model’s redzone forecast range and its 200-day moving average, the latter of which matters to people who buy into technical analysis, we set up a useful question to answer. Here’s the set-up and question:

The S&P 500’s trajectory breaking below the bottom end of the redzone forecast range comes as the index coincidentally dropped below its 200-day moving average. For the record, the upper and lower limits we set for the redzone forecast range are not based on the moving averages used in technical analysis, which we view as unreliable indicators at best. It’s more useful to ask if that change is an an outlier event or a warning signal indicating order is breaking down in the stock market.

We can find the answer to these questions by borrowing some well-established techniques from statistical analysis. In the following chart, we’ve tracked the day-to-day trajectory of the S&P 500 index with respect to its trailing twelve-month dividends per share.

S&P 500 index value versus trailing-year dividends per share, June 30, 2023 through present

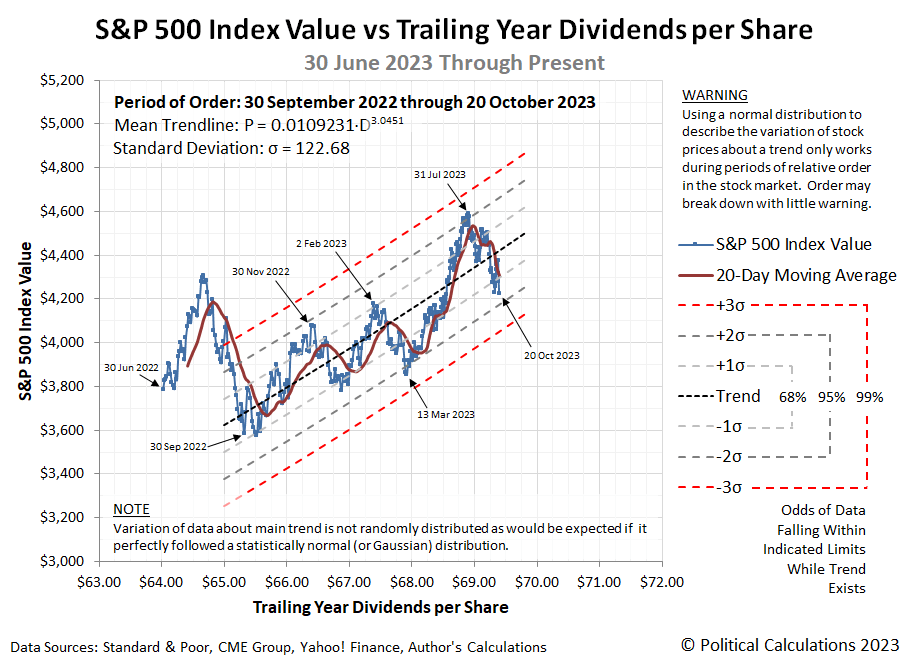
Framing the data this way allows us to first verify the S&P 500 has been in a relative period of order since September 30, 2022 and to establish the range where we would expect to find the value of the index while that order holds. We find that through Friday, October 20, 2023, the level of the S&P 500 is neither an outlier nor has the current period of relative order for the index broken down.

For it to be either, the S&P 500 would need to first drop roughly another four percent from its October 20, 2023 closing value. If then it were an outlier, it would quickly bounce back up above the red-dashed line and resume following its established trend. If order were to break down instead, the S&P 500 would stay below the red-dashed curve for a sustained period of time.

Of the two scenarios, having order break down is the one to worry about, because that would be a real sell signal. To understand why that matters, check out what happened after investors got the “ultimate sell signal” in 1929.

Original Post

Editor’s Note: The summary bullets for this article were chosen by Seeking Alpha editors.

Read the full article here

News Room October 24, 2023 October 24, 2023
Share this Article
Facebook Twitter Copy Link Print
Leave a comment Leave a comment

Leave a Reply Cancel reply

Your email address will not be published. Required fields are marked *

Finance Weekly Newsletter

Join now for the latest news, tips, and analysis about personal finance, credit cards, dept management, and many more from our experts.
Join Now
Jamie Dimon gets real at Davos.

Watch full video on YouTube

How The Iran War Is Impacting Travel

Watch full video on YouTube

President Trump speaks at the World Economic Forum

Watch full video on YouTube

Home Relistings Are Rocketing But Housing Supply Is Still Low

Watch full video on YouTube

Harbor Diversified International All Cap Fund Q4 2025 Commentary (HAIDX)

Harbor Capital is an asset manager focused on curating an intentionally select…

- Advertisement -
Ad imageAd image

You Might Also Like

News

Harbor Diversified International All Cap Fund Q4 2025 Commentary (HAIDX)

By News Room
News

RPV: This Pure Value ETF Is A Reliable Player For Uncertain Conditions And Long Term

By News Room
News

Intel shareholder claims board gave US an equity stake to avoid Trump’s social media attacks

By News Room
News

Oracle shares rally on strong revenue forecast from AI data centres

By News Room
News

There is no easy exit to Trump’s war

By News Room
News

The thing that everyone expected to happen has happened

By News Room
News

Lego chief hits out at Danish wealth tax proposal

By News Room
News

Iran hardliners cast slain supreme leader as martyr to rally regional allies

By News Room
Facebook Twitter Pinterest Youtube Instagram
Company
  • Privacy Policy
  • Terms & Conditions
  • Press Release
  • Contact
  • Advertisement
More Info
  • Newsletter
  • Market Data
  • Credit Cards
  • Videos

Sign Up For Free

Subscribe to our newsletter and don't miss out on our programs, webinars and trainings.

I have read and agree to the terms & conditions
Join Community

2023 © Indepta.com. All Rights Reserved.

Welcome Back!

Sign in to your account

Lost your password?