
Two weeks have passed since my last article, and the key level of 4325 highlighted back then should have kept readers on the right side of the S&P 500’s (SP500) recent rally.
Given the recovery and the strong end to August, the focus is now on whether we can look for direct new highs or if there will be another dip. What can we expect in September?
To answer this, a variety of tried and tested technical analysis techniques will be applied to the S&P 500 in multiple timeframes. The aim is to provide an actionable guide with directional bias, important levels, and expectations for price action. The evidence will then be compiled and used to make a call for the week(s) ahead.
S&P 500 Monthly
The August bar recovered well into the end of the month and closed at 4507. This was far from the <4325 close needed to flip the chart bearish, and comfortably above the July low of 4385. It keeps the bullish bias intact for at least new highs above the July high of 4607.
While the probability of new highs can keep us bullish at supports, there is enough technical evidence to keep us cautious at resistance; any new highs likely fade. As pointed out in the last article, “Volume decreases significantly below 4325 and above 4600; trading (volume) tends to happen inside the range.”
Furthermore, the September bar is number 9 (of a possible 9) Demark exhaustion count. The dip in August was probably an early reaction, but I’d expect a more prolonged effect. The Dax in Germany could be a possible guide as it registered exhaustion back in June. Its bar 8 was bearish but was followed by a new high on bar 9. This then led to a larger drop on the subsequent bar. Basically, it struggled to hold any gains and has traded a large range for around 4 months. I’d expect something similar in the S&P500.
SPX Monthly (Tradingview)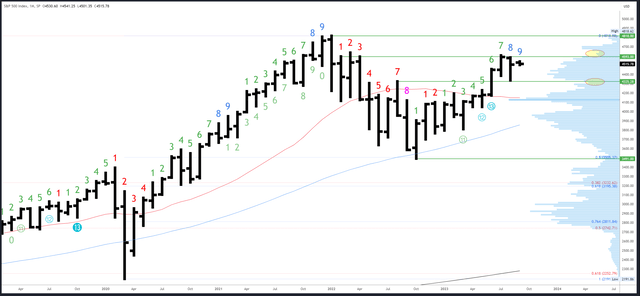
Monthly resistance is 4593-4607. 4637 is the next level above, then the all-time high of 4818.
4325-35 is significant support followed by 4195-4200.
S&P 500 Weekly
While the previous week’s inside bar was inconclusive, this week’s break of the 4458 high created an ‘inside and up’ reversal which flips the chart bullish again and should have cemented the bottom (for now) at 4335. Even so, the rally is just a move inside the 4335-4607 range and not necessarily setting up an immediate break-out. We would need to see more bullish action on the daily chart or a close next week near 4600 to call the break.
SPX Weekly (Tradingview)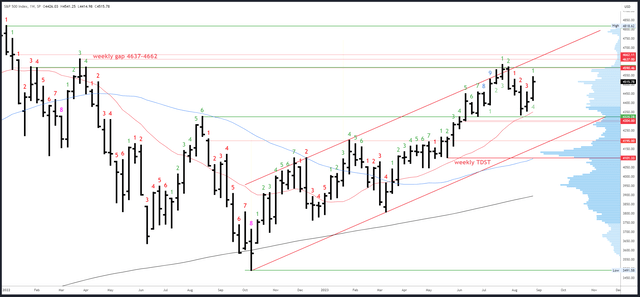
4594-4607 is the next resistance. A break of 4607 should lead to the weekly gap at 4637-4662.
A small weekly gap at 4405-4415 is the first potential support area, with 4356 below. 4325-35 remains the key level, with a small gap at 4298-4304 should this area be flushed.
An upside (Demark) exhaustion count completed in July and has already had an effect with the August drop. A new upside count will be on bar 2 (of 9) next week.
S&P 500 Daily
This week’s rally reclaimed the 20dma and the 50dma but stalled at the old channel. The reaction from the 4541 high hasn’t created a solid reversal pattern, yet, but one could develop with follow through below 4501, and more importantly, 4493.
Friday’s reversal came on bar 8 of a Demark exhaustion count. A reaction on bars 8 or 9 is normal and should lead to a pause/pullback over several sessions.
SPX Daily (Tradingview)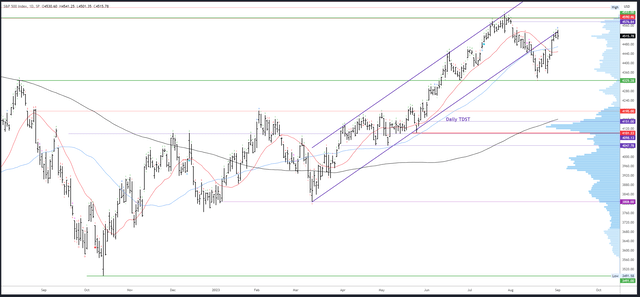
The gap at 4550-4576 is resistance, as is the old channel.
Potential supports are at 4415 and 4356. The 20dma and 50dma may come into play if they line up with other levels but more likely they are simply chopped through and become insignificant for now.
Upside Demark exhaustion will be on bar 9 (of 9) on Monday.
Events Next Week
The S&P500 will be closed on Monday for Labor Day. Tuesday’s re-open will depend on moves in Asia/Europe and could make a large gap.
US data is on the light side next week. Furthermore, a September pause from the Fed is almost guaranteed and data over the coming weeks is unlikely to influence policy for the November meeting. Bulls therefore want to see reasonably strong data as anything too weak will stoke recession fears.
ISM Services PMI on Wednesday and Unemployment Claims on Thursday are the highlights.
Probable Moves Next Week(s)
Bigger picture, new highs above 4607 remain probable but are likely unsustained. We can therefore stay bullish and look to buy dips, but be careful if any new highs fail; monthly exhaustion is still in play and could lead to another large drop and trading in a range.
Nearer-term, the issue is how exactly the S&P500 gets to new highs. There are two main scenarios for next week and beyond.
1) the S&P500 is in a new phase of the uptrend starting at 4335 and will continue directly higher to break 4607 and target 4637-4662. 4493 should really hold for this scenario to play out.
2) the S&P500 is still in a correctional phase that trades a 4335-4607 range for several weeks to set up an eventual break higher.
Given the stiff resistance at the daily channel re-test and 4550 gap, combined with daily exhaustion, I favour the second scenario. Attempts above 4550 likely fade for 4415. There doesn’t seem to be a catalyst for a deeper drop, but a later move to 4356 can’t be ruled out.
Read the full article here

