
The S&P500 (SPY) made a lower high this week for only the second time since the rally started back in October 2023 and the first time since the week of 2nd January. This is another shift in behaviour to add to those outlined in last weekend’s article and there is growing evidence the bulls are tiring. That said, the trend channel held Friday’s drop, and there has not yet been a decisive breakdown to confirm a bearish shift, yet.
This weekend’s article will look at what needs to happen for this shift to take place. Various techniques will be applied to multiple timeframes in a top-down process which also considers the major market drivers. The aim is to provide an actionable guide with directional bias, important levels, and expectations for future price action.
S&P 500 Monthly
Friday’s close of 5117 kept the March bar above the February 5111 high. With two weeks left in the month, there is a still a lot that can happen, but momentum does look to be stalling. A drop back into the February range and close below 5111 could develop into a higher timeframe reversal pattern.
SPX Monthly (Tradingview)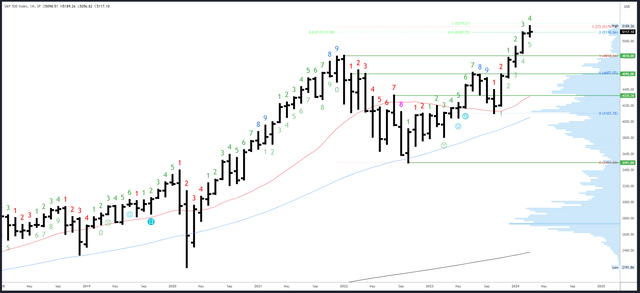
The 127% Fibonacci extension of the 2021-2022 drop has been tested at 5179. The next level of interest is 5219 where the current rally from the October ’23 low will be equal to the October ’22 – July ’23 rally.
5096-5111 is the first area of support and could set the bullish/bearish tone for the rest of March. 4818 is the first major support level at the previous all-time high.
There will be a long wait for the next monthly Demark signal. March is bar 4 (of a possible 9) in a new upside exhaustion count.
S&P 500 Weekly
This week’s open and close were very close together and formed a “doji” for the second week in a row. This is a signal of indecision. Furthermore, all this week’s action happened inside the range of the previous week, forming an “inside bar.” Again, this is a signal of indecision.
SPX Weekly (Tradingview)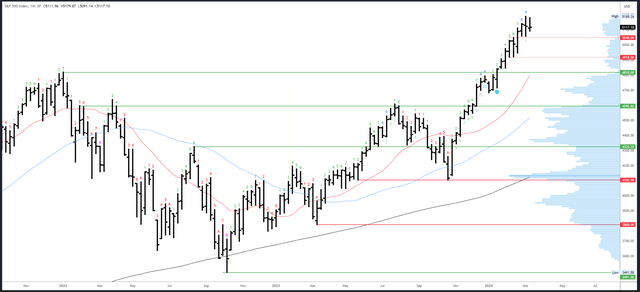
These weekly signals are finally reflecting the weaker price action we have seen throughout February and March. In November and December the price action was extremely bullish and dips were very shallow. However, recently there have been more sharp dips and they have been getting deeper. New highs have also started to fail.
The 5189 high is the only real resistance.
5048-5056 is a key support area. Below there, 4918-20 is potential support but likely only a bounce area on the way to 4818.
An upside Demark exhaustion count completed on bar 9 (of 9) last week. This usually leads to a pause / dip of several bars (weeks).
S&P 500 Daily
This week’s high came on a Tuesday, which is not bullish. That said, the low of the week came on Monday, which is not bearish (bears want new weekly lows on a Friday). This all plays into the theme of mixed signals and indecision. Neither side has really made a move, yet.
Friday’s drop tested and held the channel. This area is now key and should decide the bull/bear battle.
SPX Daily (Tradingview)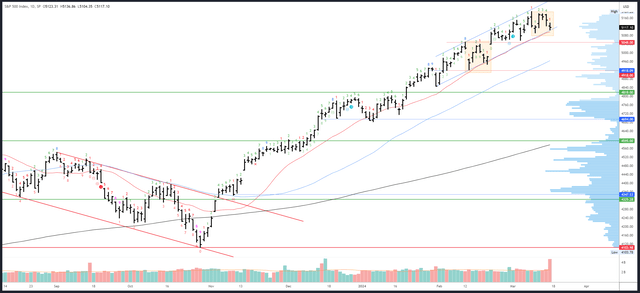
I have highlighted a similar pattern from mid February on the chart above. This shows how bulls can take the initiative and continue the rally. Bears need a weak close below 5091.
5179-89 is clear resistance.
Friday’s 5104 low came right on the channel and marks support. However, the 20dma is slightly below and this week’s 5091 low is also relevant. The 5091-5104 area is therefore the key area. 5048-5056 is the next important support.
The choppy conditions have not allowed a Demark exhaustion signal to progress and no daily signal can complete next week.
Drivers/Events
This week’s CPI reaction was a bit baffling, and likely just a function of the preceding drop and positioning into triple witching. PPI was too hot to ignore, though, and weakness in Retail Sales and the Empire State Manufacturing Index also weighed. Stocks want to see strong data – in fact, the hotter the better since the Fed haven’t put any conditionality on their dovish stance.
Next week is quiet until the FOMC meeting on Wednesday. No policy changes are expected, and coming so soon after Powell’s testimony, it would be a surprise to see any change in the dovish tone. This gives a slight bullish bias to the expected reaction, but also means we could see a very bearish reaction should the Fed make any hawkish shift.
On a side note, the odds of a June cut have now slipped to just 55% and the 10Y yield is on the verge of breaking 4.327%, which is a key inflection for long-term yields.
PMIs are released on Thursday and will be an important read on the economy.
Probable Moves Next Week(s)
The charts show indecision rather than a strong signal either way. Given the strength of the bullish trend and the hold of support on Friday, the odds still slightly favour the bulls. However, the red flags are mounting and the rally is at a key inflection point. The odds for a bearish shift are the highest since January and a weak close below 5091 would break the near-term trend. A drop under 5048 could then be conclusive and should lead to an eventual (temporary) break of 4818.
Read the full article here

