
The ProShares UltraPro Short S&P500 ETF (NYSEARCA:SPXU) is one of the most popular instruments to short the broad market for trading or hedging purposes. However, its daily -3X leverage factor is a source of drift. It must be closely monitored to detect changes in the drift regime. This article explains what “drift” means, quantifies it in more than 20 leveraged exchange-traded funds, or ETFs, shows historical data, and finally concludes about the current market conditions. The analysis is also valid for the Direxion Daily S&P 500 Bear 3X Shares ETF (SPXS), which tracks the same index with the same factor and has an almost identical behavior.
Why do leveraged ETFs drift?
Leveraged ETFs often underperform their underlying index leveraged by the same factor. An ETF’s decay may have four reasons: beta-slippage, roll yield (when futures are used), tracking errors and management costs. Beta-slippage is the main one for equity leveraged ETFs. However, when an asset is in a steady trend, leveraged ETFs can bring an excess return instead of a decay. You can follow this link to learn more about beta-slippage.
Monthly and yearly drift watchlist
There is no standard or universally recognized definition for the drift of a leveraged ETF. Some are quite complicated. Mine is simple and based on the difference between the leveraged ETF performance and Ñ times the performance of the underlying index on a given time interval, if Ñ is the leveraging factor. Most of the time, this factor defines a daily objective relative to an underlying index. However, some dividend-oriented leveraged products have been defined with a monthly objective (mostly defunct high yield ETNs sponsored by Credit Suisse and UBS: CEFL, BDCL, SDYL, MLPQ, MORL…).
First, let’s start by defining “Return”: it is the return of a leveraged ETF in a given time interval, including dividends. “IndexReturn” is the return of a non-leveraged ETF on the same underlying asset in the same time interval, including dividends. “Abs” is the absolute value operator. My “Drift” is the drift of a leveraged ETF normalized to the underlying index exposure in a time interval. It is calculated as follows:
Drift = (Return – (IndexReturn x Ñ))/ Abs(Ñ)
“Decay” means negative drift. “Month” stands for 21 trading days, “year” for 252 trading days.
|
Index |
Ñ |
Ticker |
1-month Return |
1-month Drift |
1-year Return |
1-year Drift |
|
S&P 500 |
1 |
SPY |
-2.78% |
0.00% |
11.09% |
0.00% |
|
2 |
SSO |
-6.13% |
-0.29% |
13.03% |
-4.58% |
|
|
-2 |
SDS |
6.47% |
0.46% |
-14.16% |
4.01% |
|
|
3 |
UPRO |
-9.52% |
-0.39% |
12.83% |
-6.81% |
|
|
-3 |
SPXU |
9.12% |
0.26% |
-24.99% |
2.76% |
|
|
ICE US20+ Tbond |
1 |
TLT |
-5.00% |
0.00% |
-11.06% |
0.00% |
|
3 |
TMF |
-16.18% |
-0.39% |
-43.48% |
-3.43% |
|
|
-3 |
TMV |
14.73% |
-0.09% |
36.64% |
1.15% |
|
|
NASDAQ 100 |
1 |
QQQ |
-2.53% |
0.00% |
28.84% |
0.00% |
|
3 |
TQQQ |
-9.29% |
-0.57% |
65.25% |
-7.09% |
|
|
-3 |
SQQQ |
7.78% |
0.06% |
-58.45% |
9.36% |
|
|
DJ 30 |
1 |
DIA |
-1.65% |
0.00% |
4.79% |
0.00% |
|
3 |
UDOW |
-6.25% |
-0.43% |
-3.12% |
-5.83% |
|
|
-3 |
SDOW |
5.90% |
0.32% |
-6.81% |
2.52% |
|
|
Russell 2000 |
1 |
IWM |
-7.71% |
0.00% |
-7.48% |
0.00% |
|
3 |
TNA |
-22.86% |
0.09% |
-37.40% |
-4.99% |
|
|
-3 |
TZA |
26.47% |
1.11% |
16.62% |
-1.94% |
|
|
MSCI Emerging |
1 |
EEM |
-2.74% |
0.00% |
9.47% |
0.00% |
|
3 |
EDC |
-9.36% |
-0.38% |
6.32% |
-7.36% |
|
|
-3 |
EDZ |
9.32% |
0.37% |
-23.91% |
1.50% |
|
|
Gold spot |
1 |
GLD |
7.96% |
0.00% |
19.62% |
0.00% |
|
2 |
UGL |
15.84% |
-0.04% |
30.46% |
-4.39% |
|
|
-2 |
GLL |
-13.81% |
1.06% |
-25.52% |
6.86% |
|
|
Silver spot |
1 |
SLV |
4.92% |
0.00% |
18.69% |
0.00% |
|
2 |
AGQ |
9.14% |
-0.35% |
24.64% |
-6.37% |
|
|
-2 |
ZSL |
-10.58% |
-0.37% |
-37.98% |
-0.30% |
|
|
S&P Biotech Select |
1 |
XBI |
-10.72% |
0.00% |
-19.43% |
0.00% |
|
3 |
LABU |
-32.02% |
0.05% |
-63.56% |
-1.76% |
|
|
-3 |
LABD |
36.41% |
1.42% |
36.56% |
-7.24% |
|
|
PHLX Semicond. |
1 |
SOXX |
-7.45% |
0.00% |
37.90% |
0.00% |
|
3 |
SOXL |
-23.00% |
-0.22% |
71.95% |
-13.92% |
|
|
-3 |
SOXS |
24.29% |
0.65% |
-77.14% |
12.19% |
- The leveraged bull Nasdaq 100 ETF (TQQQ) has the worst monthly decay of this list with -0.57%.
- The worst 1-year decay is in the leveraged bull semiconductor ETF (SOXL) with -13.92%.
- The leveraged bear biotechnology ETF (LABD), has the highest positive drifts in one month: 1.42%.
- The highest drift in a trailing year is for the leveraged bear semiconductor ETF (SOXS): +12.19%, in a large loss.
Positive drift is subsequent to a steady trend in the underlying asset, whatever the trend direction and the ETF direction. It means positive drift may come with a gain or a loss for the ETF. Negative drift comes with daily return volatility (“whipsaw”). Whipsaw happens more often in downtrends of the underlying asset.
SPXU historical drift
Trading or hedging with SPXU has worked very well in the first week of the 2020 market meltdown (2/21 to 2/28/2020): it has gained about 40%, significantly more than SPY return on the same period of time (-11%) multiplied by the leveraging ratio (-3). It is a significant excess return due to beta-slippage. Then, I have issued a warning on 3/10/2020 against leveraged equity ETFs. In a few weeks, SPY lost 17.5% and SPXU gained about 16% in the same time: less than shorting SPY without leverage. Since then, the monthly drift has oscillated between positive and negative values, but the 12-month drift was negative until February 2021. It jumped back in positive territory when the market crash went out of the look-back period, spiked in April 2021 and fell below zero in March 2022. It has been positive again since the second half of June this year.
The next chart plots the 12-month drift of SPXU starting 12 months after inception (6/23/2009). The average is slightly positive (0.30%).
SPXU drift since June 2009 (Chart: author; data: Portfolio123)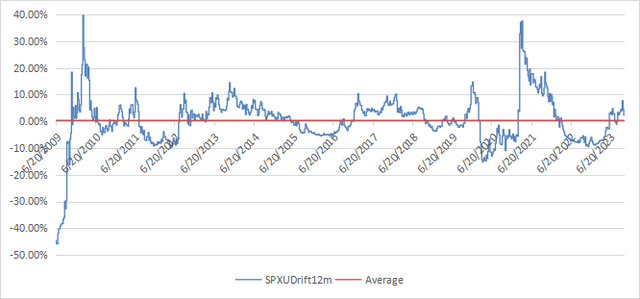
The next chart plots the drift on a longer time frame, from January 2000. It is calculated with synthetic prices based on the underlying index before the fund’s inception. On this period including two market cycles, the historical average is negative: -3.06%.
Drift since January 2000 (with synthetic prices) (Chart: author; data: Portfolio123)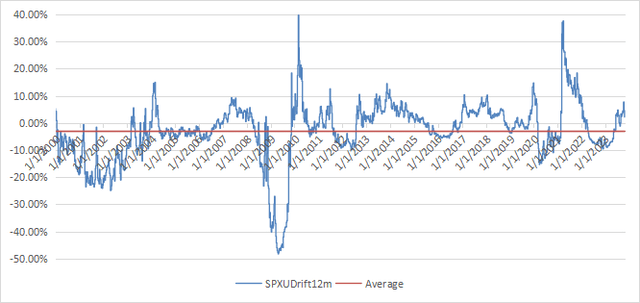
Conclusion
ProShares UltraPro Short S&P500 ETF is a cheap hedging instrument compared to other derivatives. Nonetheless, it may suffer a significant decay when S&P 500 daily returns oscillate between positive and negative values in periods of high price volatility. The VIX index (implied volatility) is not directly related to decay, but it may be a warning. SPXU 12-month drift is slightly positive now, but recent volatility is a reason to be cautious.
In volatile times, ETFs with less leverage should be preferred for hedging. The real drift of a hedging position depends on rebalancing dates. Rebalancing close to technical support and resistance zones may partly offset the decay.
Leveraged ETFs are designed for traders with a good understanding of the products behind the advertised leveraging factor. If you have a doubt, stay away.
Read the full article here

