Introduction
Denver-based SSR Mining Inc. (NASDAQ:SSRM) released its first quarter 2023 results on May 4, 2023.
This article aims to look at the company’s recent history, including the first quarter earnings, and find a way to invest profitably in this company through fundamental and technical analysis. All charts in this article give several years of history.
Important note: This article updates my February 13, 2023 article. I have been following SSRM on Seeking Alpha since 2021.
SSRM Assets Map (SSRM Presentation)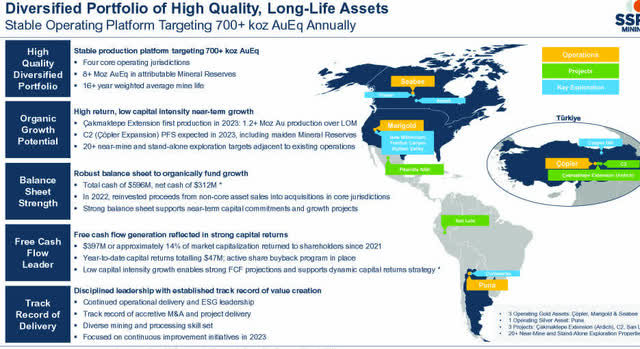
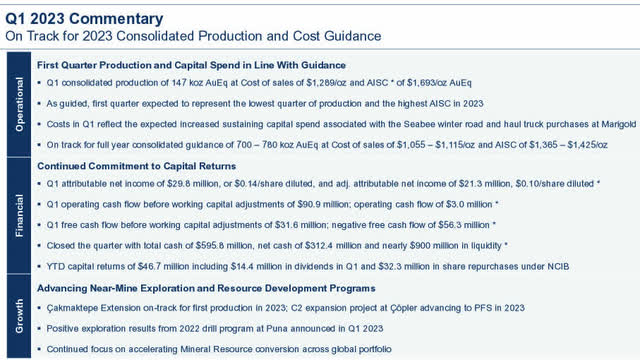
1 – 1Q23 results snapshot and commentary
The company reported adjusted earnings of $21.3 million or $0.10 per share, beating analysts’ expectations.
Gold equivalent production dropped to 146,894 GEOs, but the company sold 154,557 GEOs at the cost of sales of $1,289/oz and AISC of $1,693 per equivalent gold ounce. The gold was sold at $1,902 per GEO.
Note: As guided, the first quarter is expected to represent the lowest quarter of production and the highest AISC in 2023,
For the three months that ended March 31, 2023, revenue increased sequentially to $314.61 million, but down 11.5% compared to $355.45 million for the three months that ended March 31, 2022.
During the first quarter of 2023, the Company announced 2023 production guidance of 700k to 780K GEOs at a consolidated cost of sales of $1,055 to $1,115 per GEO and AISC of $1,365 to $1,425 per GEO.
In addition, SSR Mining’s three-year outlook highlighted a strong and stable production base of approximately 700 thousand gold equivalent ounces through 2025 without requiring significant capital investment. Full year projected production and cost expectations remain aligned with the existing consolidated guidance ranges.
Below is the production per mine 4Q22 versus 1Q23.
SSRM Quarterly Gold Production per mine 4Q22 versus 1Q23 (Fun Trading)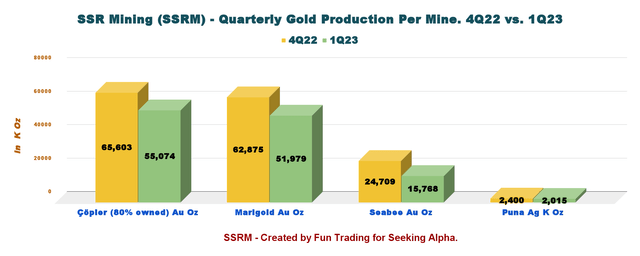
As the company warned earlier, the quarter was particularly weak compared with the fourth quarter of 2022.
However, the investment thesis remains unchanged from the preceding article. SSR Mining Inc. stock is a good candidate for the long term, despite recurring hiccups.
The balance sheet is sound, and the assets’ quality is solid, with an impressive pipeline. The company should deliver growth for the next few years. Furthermore, most of the company’s assets are in North America, which is extra security. Finally, SSRM pays a dividend yield of 1.96%.
However, trading short-term LIFO for a minimum of 50% of your SSRM position is paramount to take advantage of the gold price volatility that will continue in 2023, with the FED expected to raise interest at least twice more after pausing temporarily last month.
The gold and silver prices are weakening a little now but are still significantly up on a one-year basis.
SSRM 1-Year Chart Gold, Silver, Copper (Fun Trading StockCharts)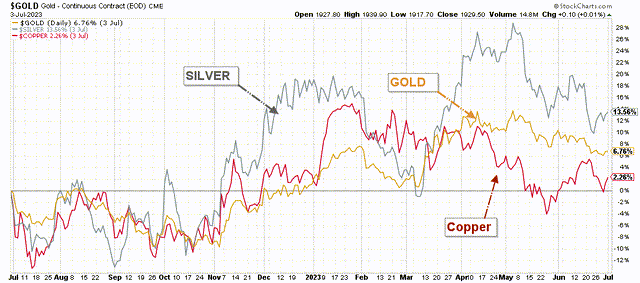
CEO Rodney Antal said in the conference call:
With a robust exploration platform and a number of growth initiatives already underway, we continue to expect that we can deliver the baseline production level through the remainder of the decade.
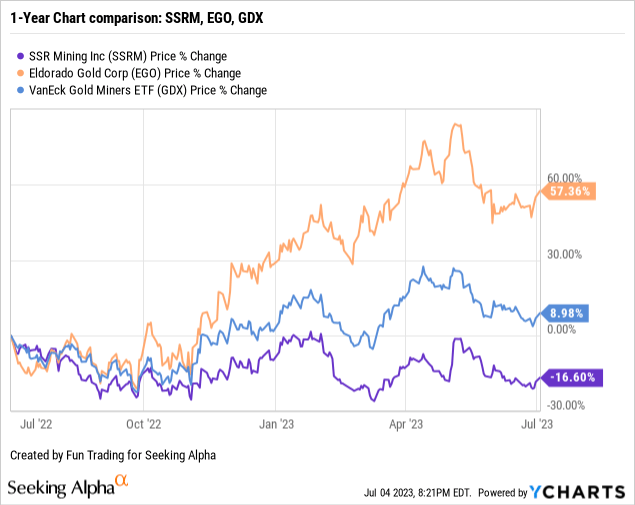
2 – Stock performance
SSRM underperformed the VanEck Vectors Gold Miners ETF (GDX) and Eldorado Gold (EGO), which owns two mines in Turkiye. SSRM is now down 16.6% on a one-year basis and has shown continued weakness over the last twelve months.
SSR Mining – Financial Snapshot Ending 1Q23: The Raw Numbers
| SSRM | 1Q22 | 2Q22 | 3Q22 | 4Q22 | 1Q23 |
| Total Revenues $ million | 355.45 | 319.58 | 166.63 | 306.38 | 314.61 |
| Quarterly Earnings of $ million | 67.56 | 58.49 | -25.79 | 93.88 | 29.81 |
| EBITDA $ million | 170.96 | 116.68 | -15.93 | 169.70 | 83.95 |
| EPS (diluted) $ per share | 0.31 | 0.27 | -0.12 | 0.43 | 0.14 |
| Operating Cash Flow $ million | 62.19 | 32.84 | -52.23 | 118.10 | 2.97 |
| CapEx in $ million | 34.49 | 41.84 | 39.83 | 21.36 | 59.24 |
| Free Cash Flow | 27.70 | -9.00 | -92.05 | 96.74 | -56.28 |
| Total Cash in $ million | 1,033.22 | 964.55 | 802.31 | 695.73 | 595.49 |
| Total Debt in $ million | 353.71 | 331.93 | 228.01 | 298.31 | 280.19 |
| Shares Outstanding (diluted) | 224.74 | 225.08 | 207.98 | 219.30 | 219.40 |
| Dividend $/share | 0.07 | 0.07 | 0.07 | 0.07 | 0.07 |
Source: Company 10-Q.
* During the three months ended March 31, 2023, the Company purchased 348,171 of its outstanding common shares under the NCIB at an average share price of $14.92 per share for total consideration of $5.2 million.
SSR Mining – Gold Production and Balance Sheet Details
1 – Revenues and trends. Revenues were $314.61 million in 1Q23
SSRM Quarterly Revenues History (Fun Trading)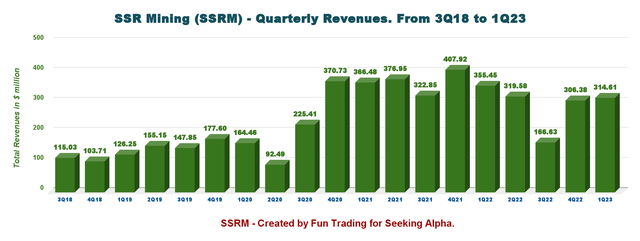
The company posted revenues of $314.61 million in the first quarter of 2023, down significantly compared with 1Q22 but up sequentially, as shown in the graph above. The decrease was mainly due to 19.8% fewer ounces of gold sold and 2.9% lower realized silver prices, partially offset by 35.3% more ounces of silver sold and a 1.2% increase in average realized gold prices.
The attributable net loss in the first quarter was $25.8 million, or $0.12 per diluted share. The adjusted net income was $21.3 million or $0.10 per share.
Revenues from gold represent 76.2% of the total revenues.
SSRM 1Q23 Revenues per metal (Fun Trading) SSRM 1Q23 Highlights (SSRM Presentation)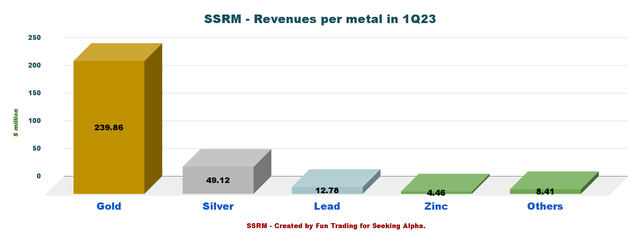
Also, on May 8, 2023, SSR Mining announced the acquisition of up to 40% Ownership Interest and operatorship in the Hod Maden Gold-Copper Project in northeastern Türkiye from Lidya Mines through an earn-in structured transaction (emphasis added):
Aggregate acquisition consideration totals $270 million, which includes $120 million in upfront cash payment to acquire a 10% interest in Hod Maden, followed by $150 million in earn-in structured milestone payments to acquire an additional 30% interest, payable between the start of construction and the first anniversary of commercial production
Transaction projected to provide SSR Mining with approximately an expected attributable 80,000 gold equivalent ounces and $66 million in free cash flow annually (at $1,599/oz gold and $3.19/lb copper) once in production, expected in 2027.
SSRM Hod Maden Map (SSRM Press Release)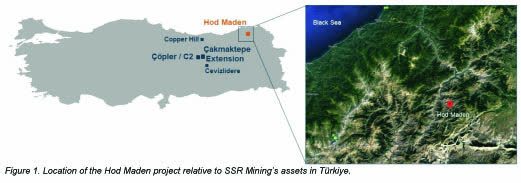
2 – Free cash flow was a loss of $56.28 million in 1Q23
SSRM Quarterly Free Cash Flow History (Fun Trading)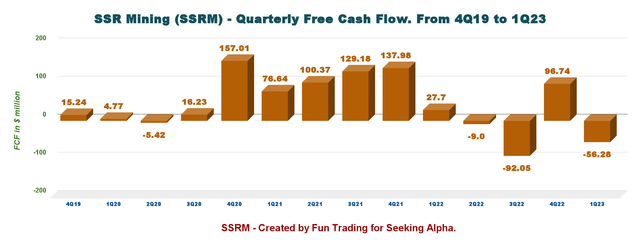
Trailing 12-month free cash flow was a loss of 60.59 million, with the first-quarter 2023 free cash flow loss of $56.28 million.
The company declared a quarterly dividend of $0.07 per share or a dividend yield of 1.96%.
During the three months that ended March 31, 2023, the Company repurchased 348,171 common shares, for $5.2 million, at a weighted average price paid per common share of $14.92.
3 – An impressive debt profile with no net debt
SSRM Quarterly Cash versus Debt History (Fun Trading)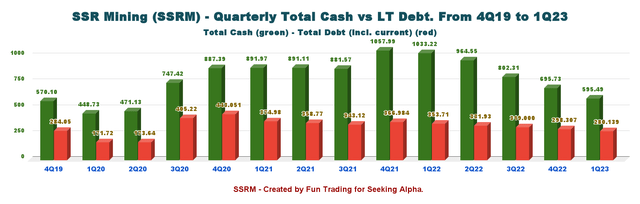
On March 31, 2023, cash and cash equivalents and others were $595.49 million, down from $1,033.22 million in 1Q22. The total cash registered a decrease of $93.7 million from December 31, 2022, mainly due to cash used in the Company’s investing and financing activities.
Total Debt is $280.14 million with net debt to EBITDA ratio of 0.9x.
SSRM Balance Sheet (SSRM Presentation)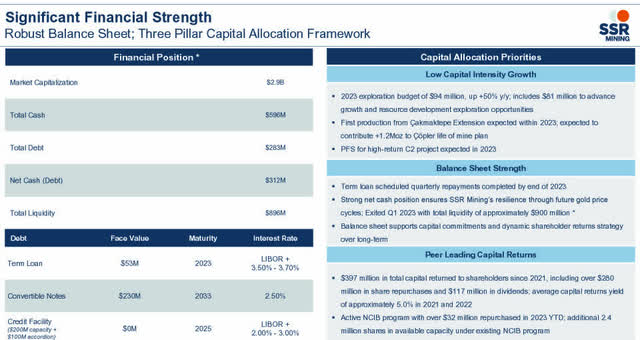
4 – Gold equivalent production details. The company produced 146,894 Au Equivalent Oz in 1Q23
SSRM Quarterly Gold Equivalent History (Fun Trading)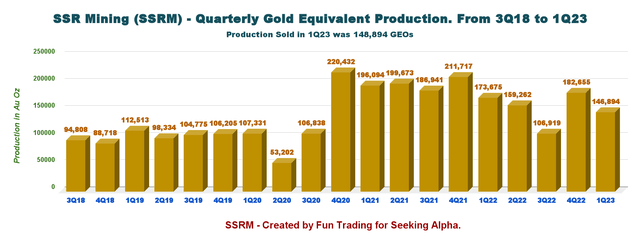
Gold equivalent produced dropped 42.8% year-over-year to 106,919 oz in the third quarter and was down 32.9% sequentially. Also, the gold equivalent sold was 96,885 GEOs. This quarter was a particularly weak production, with Çöpler and Seabee underperforming.
SSRM 1Q23 Production per Mine (Fun Trading)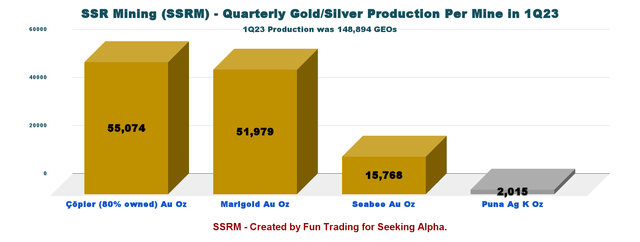
Note: Puna mine in Argentina only produces silver, lead, and zinc.
SSRM Quarterly Gold and Silver Price History (Fun Trading)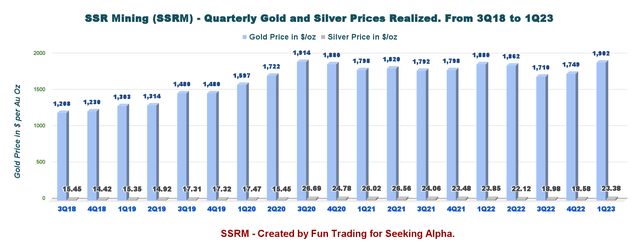
The average realized gold price decreased by 4.6% to $1,710 per ounce from the year-ago quarter. The average realized silver price was $18.98 per ounce in the quarter, down year-over-year by 21.1%. However, I expect a rebound starting Q4 2022, with gold averaging $1,736 per ounce.
5 – All-in sustaining costs and cash costs
SSRM Quarterly AISC per GEO History (Fun Trading)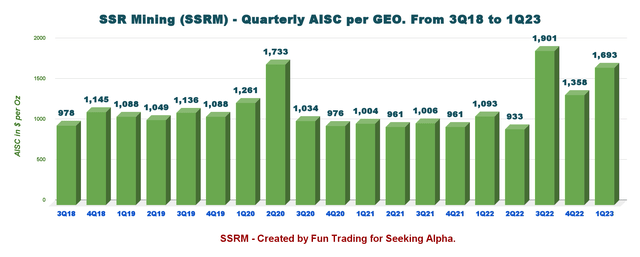
AISC per gold equivalent ounce sold decreased to $1,901 per ounce in 3Q22 from $1,006 a year ago. The whopping jump was due to the situation at Çöpler mine, which indicated an AISC of $14,972 per ounce in 3Q22. According to the company, the AISC will drop to about $1,393 in 4Q22.
Technical Analysis (Short Term) and Commentary
SSRM TA Chart Short-Term (Fun Trading StockCharts)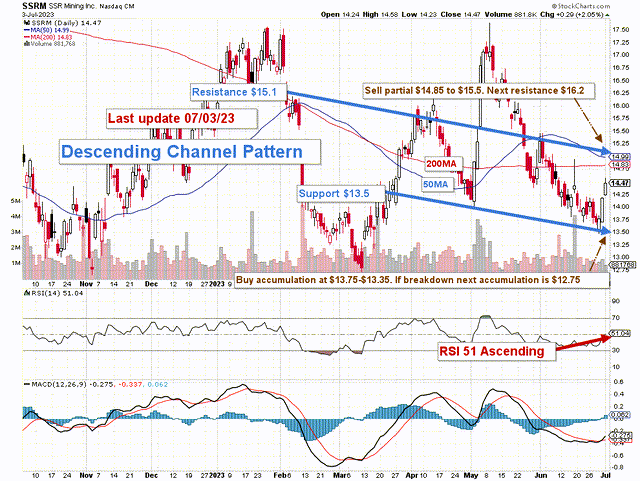
Note: The graph has been adjusted for the dividend.
SSRM forms a descending channel pattern, with resistance at $15.1 and support at $13.5.
Descending channel patterns are short-term bearish in that a stock moves lower within a descending channel, but they often form within longer-term uptrends as continuation patterns. Higher prices usually follow The descending channel pattern but only after an upside penetration of the upper trend line.
The short-term trading strategy has not changed since my preceding article. I suggest trading LIFO for about 45%-50% of your position and keeping a core long-term amount for a much higher payday.
I suggest selling between $14.85 and $15.50 with the next higher resistance at $16.2 and waiting patiently for a retracement between $13.35 and $13.75 with possible lower support at $12.75
Watch the price of gold like a hawk.
Warning: The TA chart must be updated frequently to be relevant. It is what I am doing in my stock tracker. The chart above has a possible validity of about a week. Remember, the TA chart is a tool only to help you adopt the right strategy. It is not a way to foresee the future. No one and nothing can.
Read the full article here

