Following our article from last weekend on C-Store/Gas Station owner/fuel wholesaler CrossAmerica Partners Lp (CAPL), we’re covering a similar company – Sunoco LP (NYSE:SUN) this week.
Company Profile:
Dallas-based Sunoco LP is the biggest fuel distributor in the US. It operates through two segments, Fuel Distribution and Marketing, and All Other.
The Fuel Distribution and Marketing segment purchases motor fuel from independent refiners and major oil companies and supplies it to independently operated dealer stations, distributors and other consumer of motor fuel, and partnership operated stations, as well as to commission agent locations.
The All Other segment operates retail stores that offer motor fuel, merchandise, food service, and other services that include car washes, lottery, automated teller machines, money orders, prepaid phone cards, and wireless services. It also leases and rents real estate properties.
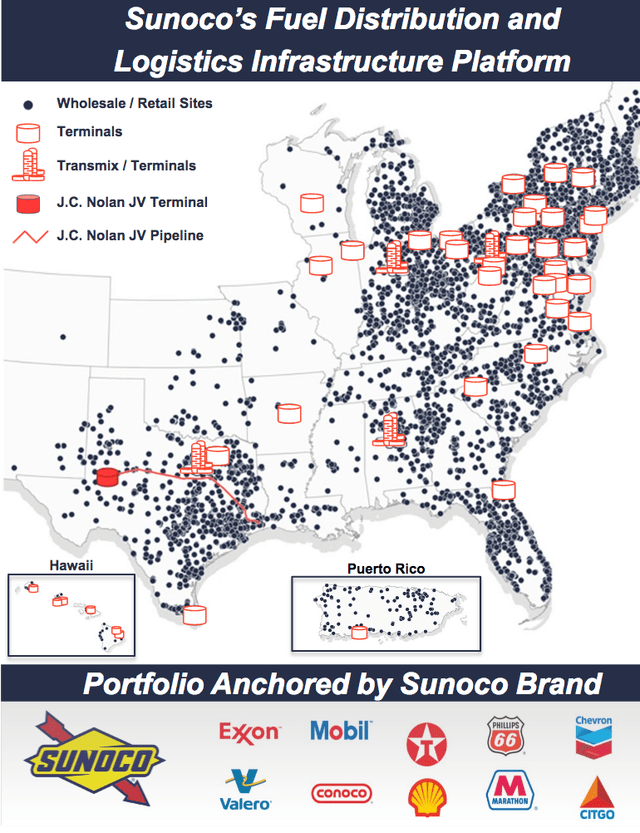
Sunoco’s retail sites are located predominantly in the eastern, Midwestern US, and in Texas, with terminals in each region, and a pipeline in Texas:
SUNOCO site
Earnings:
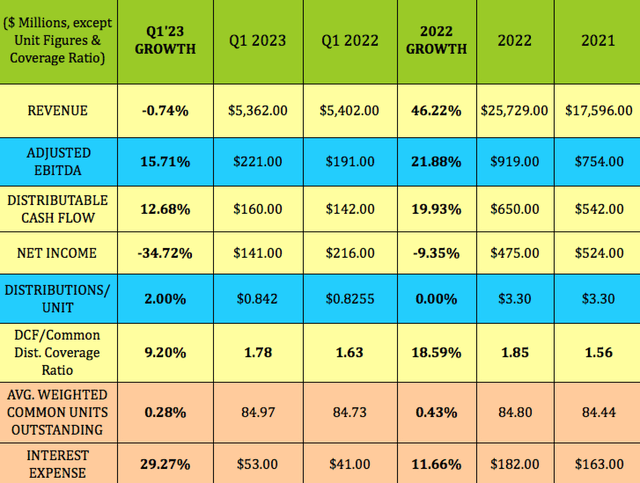
Q1 2023: SUN sold 1.9 billion gallons of fuel in Q1 2023, up ~9% vs. Q1 2022. Fuel margin for all gallons sold was 12.9 cents/gallon, vs. 12.4 cents/gallon a year ago.
Revenue was roughly flat, down less than 1%, whereas net income fell ~35%, due to higher cost of sales and a 29% rise in interest expense.
However, adjusted EBITDA rose ~16%, to $221M, a record first quarter figure, vs. $191M in Q1 ’22. Distributable cash flow, DCF, was up 12.7%, which improved distribution coverage by over 9%, to 1.78X, vs. 1.63X in Q1 ’22.
Full Year 2022: With the US reopening, SUN had a strong year, with revenue up 46%, EBITDA up ~22%, DCF up ~20%, and distribution coverage improving by 18.6%. Interest expense rose $19M, up 11.7%. The unit count was roughly flat:
Hidden Dividend Stocks Plus
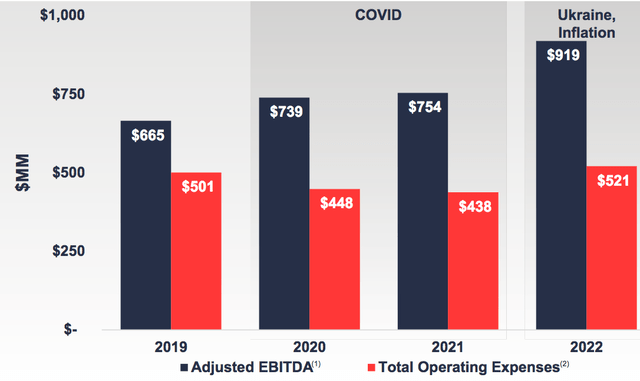
Management has contained expenses well over the past few years – since 2019, total operating expenses have grown by < 1.5% annually, while adjusted EBITDA has grown by ~10% annually:
SUNOCO site
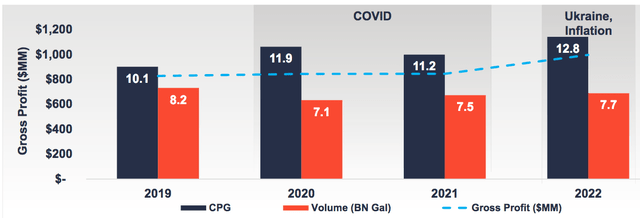
SUN has a long-term take-or-pay supply agreement with 7-Eleven, which helps stabilize its gross profit through fuel volume and cost cycles:
SUNOCO site
Acquisition:
On May 1, 2023, SUN completed the acquisition of 16 refined product terminals located across the East Coast and Midwest from Zenith Energy for $110 million. The Partnership expects the acquisition to be accretive to unitholders in the first year of ownership.
2023 Guidance:
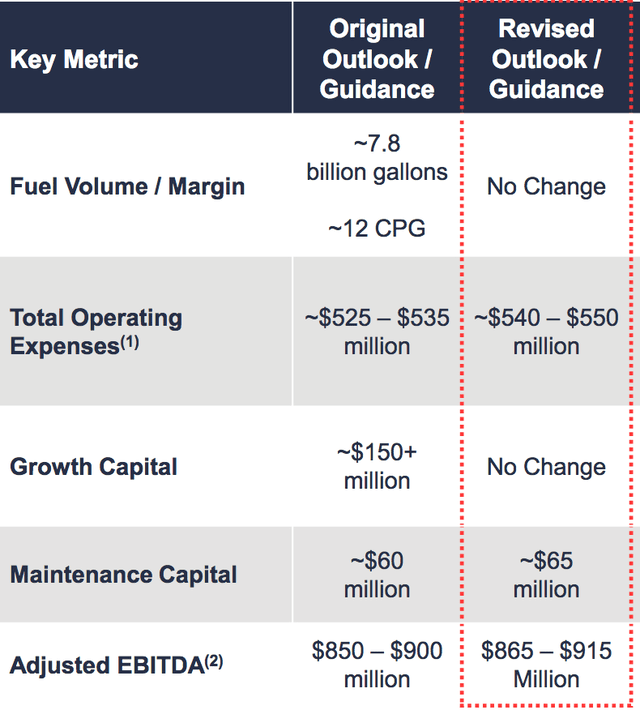
Management reaffirmed its 2023 guidance for fuel volume/margin and growth capital, while slightly increasing its outlook for adjusted EBITDA and maintenance capital, due to its Zenith Energy acquisition. Total operating expenses are now projected to be ~$540 – $550M, ~2.9% higher than previously estimated:
SUNOCO site
Dividends:
In April ’23, management declared an $0.842/unit distribution, a 2% increase vs. Q4 ’22 – its 1st increase since Q3 2016. At its 6/22/23 intraday price of $43.58, SUN yields 7.73%. It should go ex-dividend next on ~8/4/23, with a ~8/21/23 pay date.

Hidden Dividend Stocks Plus
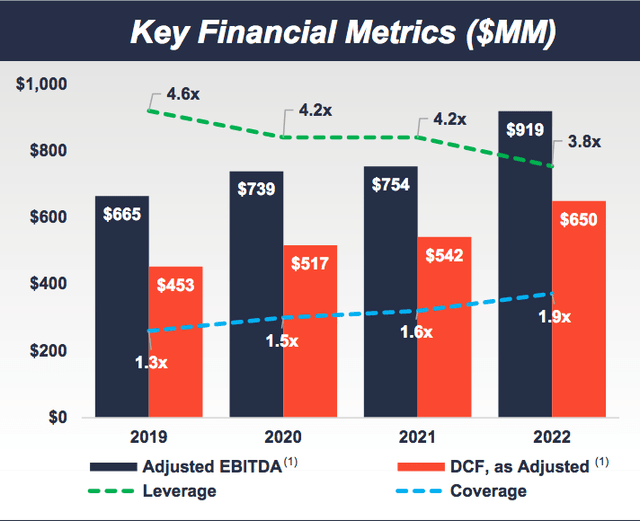
DCF/Distribution coverage has been increasing over the past few years, rising from 1.3X in 2019, all the way to 1.85X in 2022. Coverage was 1.78X in Q1 ’23.
SUNOCO site
Profitability and Leverage:
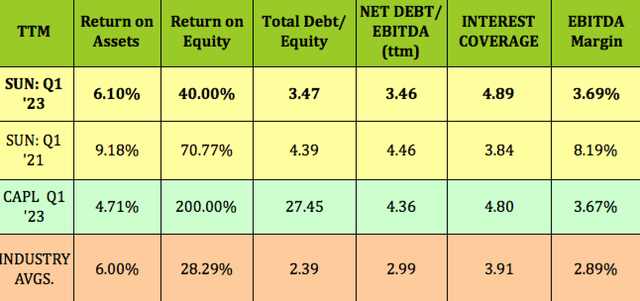
As seen in the above chart, SUN’s debt leverage also has been improving, dropping from 4.6X in 2019 to 3.8X in 2022. We show a 3.46X net debt/EBITDA figure for trailing Q1 ’23, a 100 basis point improvement vs. Q1 ’21.
While SUN and CAPL’s EBITDA margins and interest coverage factors are nearly identical, SUN has lower debt leverage, and a higher ROA. Both companies’ EBITDA margins, interest coverage, and ROE are better than industry averages:
Hidden Dividend Stocks Plus
Taxes:
SUN issues a K-1 tax form to unit holders. There may be UBTI involved for unitholders who invest in SUN via tax deferred accounts. Please consult your accountant for more details.
Debt and Liquidity:
As of 3/31/23, SUN had $800M of borrowings against its revolving credit facility, and other long-term debt of $2.7B. The Partnership maintained liquidity of ~$693M at the end of the quarter under its $1.5B revolving credit facility.
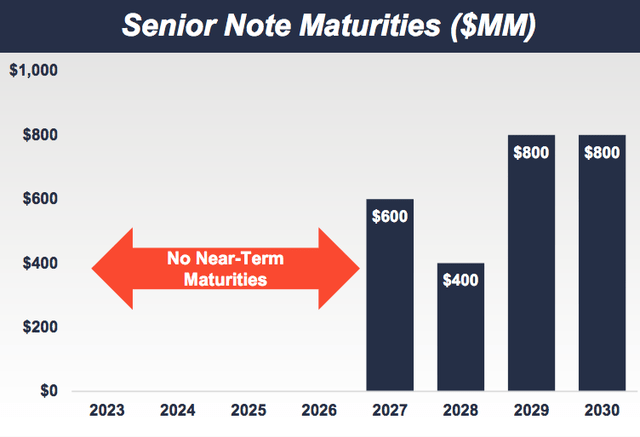
SUN’s next debt maturity isn’t until 2027, when $600M of its 6% Senior Notes comes due. Its $1.5B Credit Facility expires on April 7, 2027, and requires SUN to maintain a Net Leverage Ratio of not more than 5.50X.
SUNOCO site
Performance:
SUN has outperformed CAPL and the broad energy sector over the past month, quarter, year and year to date. While it lags the S&P 500 so far in 2023, it outperformed it over the past year.

Hidden Dividend Stocks Plus
Analyst Targets:
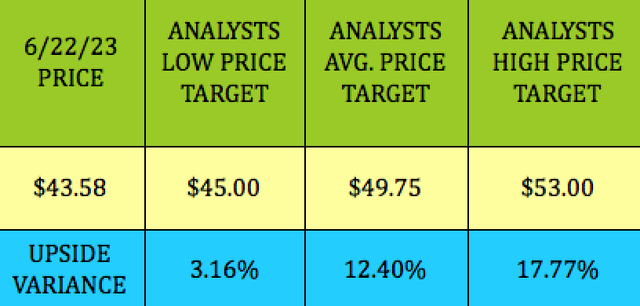
Wall Street analysts’ price target for SUN run from $45.00 to $53.00, with an average of $49.75, which is 12% above 6/22/23 price of $43.58.
Hidden Dividend Stocks Plus
Valuations:
SUN’s market cap is ~5X that of CAPL. It has a lower yield, but higher distribution coverage. SUN’s price/DCF is slightly higher than CAPL’s, but its price/book is much lower. The two companies’ P/sales and EV/EBITDA are very similar.
It’s a mixed bag for SUN and CAPL’s valuations vs. industry averages. Their yields are both higher, but so are their P/book and EV/EBITDA, whereas their P/sales figures are much lower than average.

Hidden Dividend Stocks Plus
Parting Thoughts:
SUN should have a durable place in the energy industry over the next several years. Its operations management and earnings power are strong. However, we don’t see any major under-valuations at this price level.
But stick around, if the US does go into a recession, you may be able to pick up SUN at a lower price. Short of that, you could try selling puts below its price/unit.
All tables furnished by Hidden Dividend Stocks Plus, unless otherwise noted.
Read the full article here


