For long-term income-oriented equity investors, global investment manager giant T. Rowe Price Group, Inc. (NASDAQ:TROW) should be a core holding in many portfolios. This is a company with phenomenal long-term results. Check this out:
| 5-year CAGR | 10-year CAGR | |
| Revenues | 6.0% | 7.9% |
| Net income | (1.7%) | 5.1% |
| Earnings per share | 2.3% | 7.1% |
| Dividends per share | 16.1% | 7.4% |
Source: Company filings at sec.gov
This company checks a lot of boxes. Now some readers will say, “Hey, this stock was worth over $220 just two years ago.” Yes, it sure was. But in my opinion, two years does not constitute a long-term time horizon. Neither does five years. Ten years ago, this stock was around $80 per share. Twenty years ago, it was in the $20s. $10,000 invested 20 years ago and reinvested with dividends would be worth almost $85,000 today, compared to roughly $62,000 in the S&P 500. Furthermore, the company has increased its dividends for 36 consecutive years. This is the type of company dividend investors should be looking for to fill out their portfolios. Obviously, past performance is not indicative of future performance. This analysis will examine whether the future looks just as bright for TROW and its shareholders.
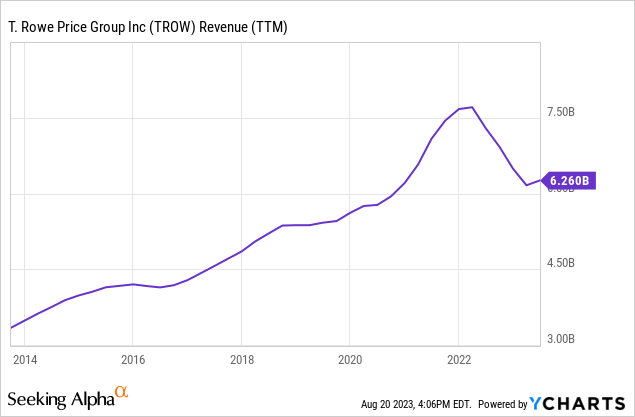
As mentioned, the company has produced annual revenue growth of 7.9% for the past 10 years ending December 31, 2022. Revenues consist primarily of investment advisory fees, which, as an investment manager of mutual funds, sub-advised funds, separately managed accounts and other investment products is how the company is paid. The company also generates administrative fees for providing a wide variety of other services to investment advisory clients. The more assets managed or administered, the more fees generated. Through the end of last year, AUM have increased over 8% annually for the past ten years, ending last year at $1.3 trillion. Mutual fund growth has stagnated somewhat, but the company has been increasing its emphasis on both sub-advised/separately managed accounts as well as other types of portfolios to help bolster overall AUM growth. Coincidently, fees have increased lock-step with AUM, and the average fee rate has been very steady, between 39 and 50 bps over the past five years.
The interesting point here is that while many competitors such as BlackRock have built their businesses recently through exchange-traded funds and passive management, TROW has bucked the trend with a continued focus on active management. That being said, TROW has introduced exchanged traded funds recently in response to client demands for additional investment solutions.
As a point of reference, revenues have continued to slide this year, although Q2 saw a YoY and sequential increase. Q1 revenues were down quite substantially from last year. It has been a difficult market for gathering investments as interest rates continue to rise, savings dwindle and the stock market, while up, has been sort of choppy this year.
It is also worth noting that the company has produced excellent performance against the various benchmarks and peer groups. The following table shows the relative performance as of June 30, 2023:
TROW relative performance (Company filings; sec.gov)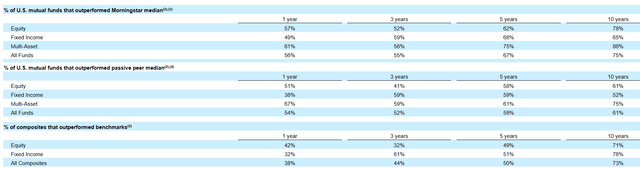
One area that needs to be watched is expense growth. Historically, management has been very good at managing expenses, especially compensation expense. Over the past five years, compensation expense averaged 34.1% of revenues. Late last year, this number jumped to 37% in Q3, 45% in Q4, 42% in Q1 this year and 40% in Q2. Part of this is the decline in revenue, but the actual dollar amount of compensation expense has increased as well. Headcount has steadily increased at about 3% annually while compensation expense has increased about 7% annually recently. Overall expenses have increased over 8% annually over the past five years, which is well above the rate of revenue growth. Management did address expenses on their Q2 earnings call. In fact, the company has instituted a slight headcount reduction initiative, announcing a reduction of about 2% of existing positions globally. Not a significant number, but it’s a start, for sure. Despite the reductions, they do expect headcount to be higher at the end of the year, so there is still some work to be done here. Finally, the company is also working through an overall expense control effort by removing or reallocating $200 million in operating expenses against the run rate. This is a good start, and an area which I am focused on going forward.
It should be noted that the year-over-year increase in compensation expense is primarily due to capital allocation-based income related compensation. Excluding this, compensation is up just 1% year over year. Nevertheless, management needs to take an aggressive approach toward managing their expense line, particularly during the periods of the cycle when AUM growth is more difficult to come by.
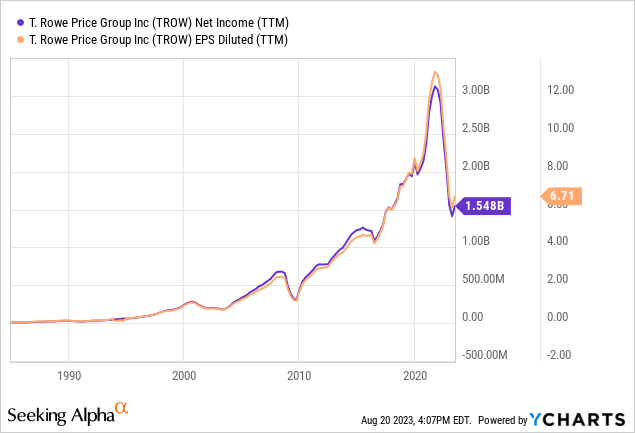
Bottom line, net income has grown 5% annually over the past 10 years and EPS has increased 7.1% annually over the same period. I think if the company can get a better grip on expenses going forward, when the next AUM growth cycle hits, income growth will surely speed up to these levels or even higher. In fact, YTD this year, net income is up 15% over the prior year period. EPS, however, is up less than 1% from the prior year.
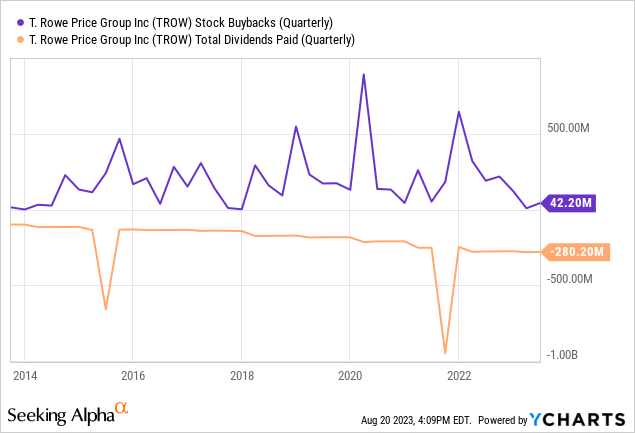
The beauty of this great income statement story is the fact that the company does not carry any long-term debt. The company has tremendous financial flexibility in the absence of any debt weighing them down. Assets have increased over 10% annually over the past ten years, while liabilities have increased over 18%. Shareholders’ equity has increased 8.7% annually during this same period. The company produces very strong operating cash flows, which allows for the return of excess capital to shareholders in the form of dividends and stock repurchases.
This financial flexibility has allowed the company to continue to pay an increasing dividend and selectively buy back shares. The dividend per share has increased 7.4% annually, excluding some special dividends that have been paid from time to time (the last ones being in 2021 and 2015). The company has reduced the outstanding share count by about 17% over the past five years, with the option to repurchase another 8.7 million shares under the current repurchase program.
One last point before we look at stock performance. In 2021, the company purchased Oak Hill Advisors, L.P., which was a leading alternative credit manager, for $3.4 billion in cash and TROW common stock. Management has indicated that the acquisition is going very well, and they remain positive over the long-term prospects for the division. It sounds like the company is still in the early stages of incorporating Oak Hill’s products and solutions to the bulk of the company’s clients.
As mentioned earlier, the stock has been an excellent performer over the long term. The last five years, however, do not look as special. The stock did have a tremendous run-up from the 2020 pandemic lows through the end of 2021. The stock outperformed the S&P 500 index over this period. In 2022, however, it was a different story as the financial markets faced a very difficult year. TROW underperformed the S&P 500 index from its peak in November 2021 through this year.
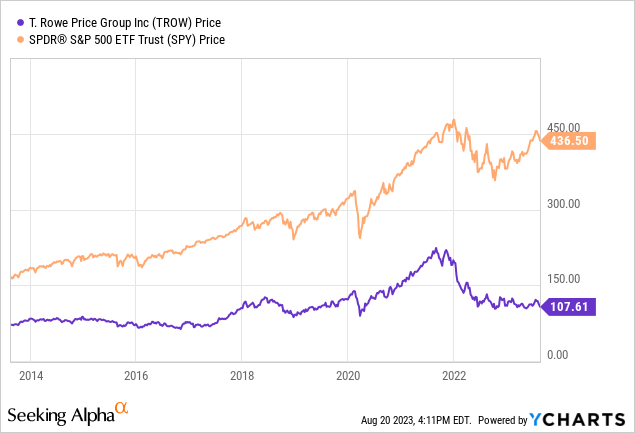
It’s unfortunate, but companies that are exposed to the financial markets get a double whammy when the markets move south. In this case, the company’s revenues dropped off due to lower management fees and the stock dropped off because stocks were selling off. One sort of feeds the other. However, on the bright side, it represents a good opportunity to get back into a great company at a discounted price. If you believe that the financial markets will be higher in ten years, then TROW could be a good bargain for your portfolio today.
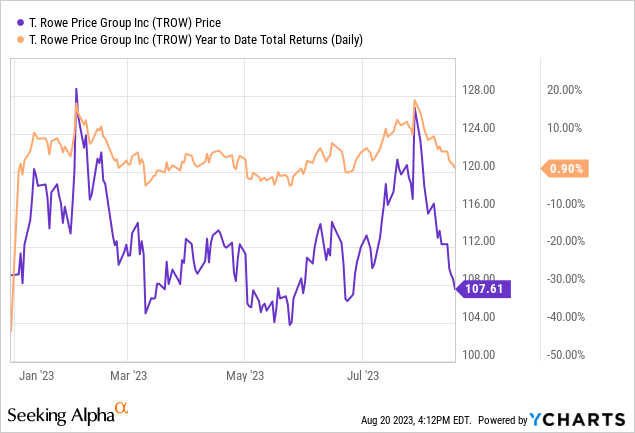
At a recent price of $107.61, the stock is basically unchanged this year, with dividends reinvested.
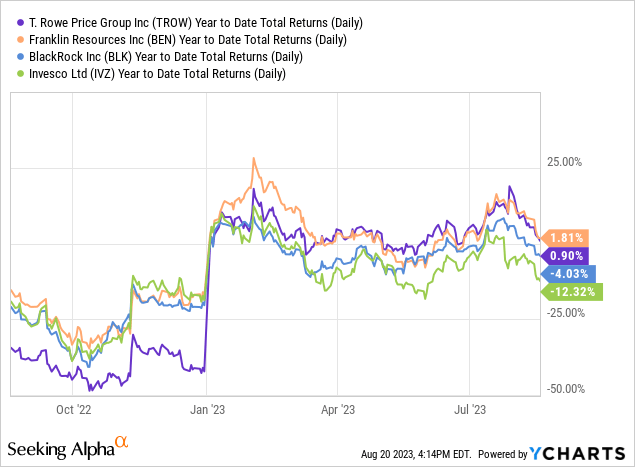
Compared to its peers, the stock has held up ok this year:
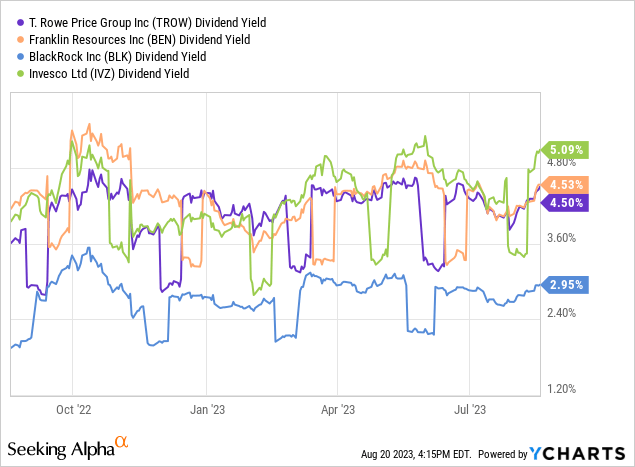
The current dividend yield of 4.53% is basically in the middle of the pack for its peers:
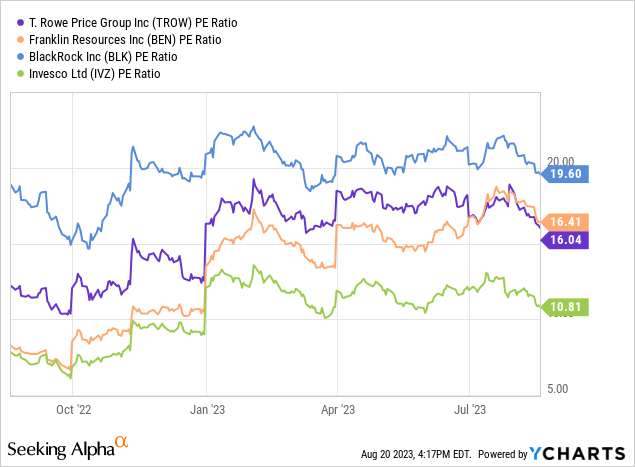
Finally, on a relative valuation level, TROW is priced slightly below its peers based on P/E ratio:
Based on my projections for revenue growth to pick up in the next few years and a much more controlled expense line, I estimate the stock to be worth about $121 per share today. That would represent an 11% increase over today’s level, plus the healthy dividend yield of about 4.5% today.
I think TROW is a great company, but it does have a few challenges today. Namely, the broader financial market is not conducive to growing and attracting new assets and the company’s expense line has been creeping up in recent years. However, this company has been around for a long time, and has performed well through various market cycles. I have every reason to believe that management will help steer the company through this challenging market environment, putting the company in a good position for its next leg up. Finally, I think the dividend is very safe, given the company’s ability to generate strong cash flow and its financial flexibility. TROW has been good for income investors in the past, and it should remain a cornerstone for investor portfolios in the future.
Read the full article here

