Due to reader demand I’ve decided to enhance our ETF coverage at iREIT© on Alpha, and in case you missed it, last week I wrote an article titled WKLY: Get Paid Every Week.
That article was well received, covering the Sofi Weekly Dividend ETF (WKLY), and we had several comments requesting that we look into another similar ETF, the Sofi Weekly Income ETF (NYSEARCA:TGIF), which was also launched by Toroso Investments and managed by Income Research & Management.
As we mentioned in that article, the idea of getting paid every week is a novel idea, but it should not be the main purpose behind investing. We often say, never invest based on dividend yield alone (avoid the sucker yields) and certainly don’t invest based on the frequency of a dividend payment (weekly, monthly, quarter, or annually).
However, let’s take a closer look at this weekly paying ETF, the Sofi Weekly Income ETF.
TGIF is different from WKLY in the fact that TGIF focuses on fixed income whereas WKLY earns its income through dividends, so they are investing more into dividend paying stocks.
TGIF is a first of its kind, having been founded on October of 2020, and the ETF aims to distribute income every Friday. The fund is actively managed, which tends to coincide with a higher expense ratio, something we’ll look at in a second, but the investments it enters into is more than 100 bonds across various industries.
SoFi Invest
The fund is small, with just $16.6 million in AUM.
As I mentioned a second ago, the fund is actively managed, thus the higher expense ratio of 0.59%, which is higher than the 0.49% we saw when we covered WKLY.
We have seen a lot of new income related or dividend related ETFs start over the past few years, with the JPMorgan Equity Premium income ETF (JEPI) quickly becoming the most popular. Investors have a desire for yield and weekly income adds to the intrigue.
Now that we have a better understanding of the structure of this income related ETF, let’s take a closer look at its performance in the 2+ years it has been around. Looking at the chart below, we can see that in terms of share price, the fund is down 5.2% since inception.
yCharts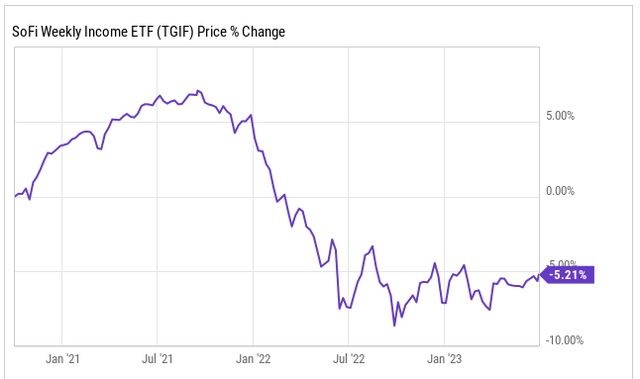
ETFs usually track an index to some degree and TGIF is no different as it tracks the Bloomberg Barclays 1-3 Year Credit Index, which more appropriately classifies the fund due to its shorter-duration focus.
Over the past year plus, we have endured a rising rate environment that seems to be slowing down soon, but the last we heard from the Federal Reserve, they’re aiming for a few more interest rate hikes.
When it comes to TGIF, they target more short-term bonds with a life of three years or less, which helps the managers reduce interest rate risk, as volatile interest rates are the primary risk.
Another risk is the credit risk related to the underlying company in which the bond is issued.
Now let’s take a closer look at the top 10 positions within the ETF, which are various corporate bonds and US treasuries. These positions are as of the end of Q1 2023.
TGIF Factsheet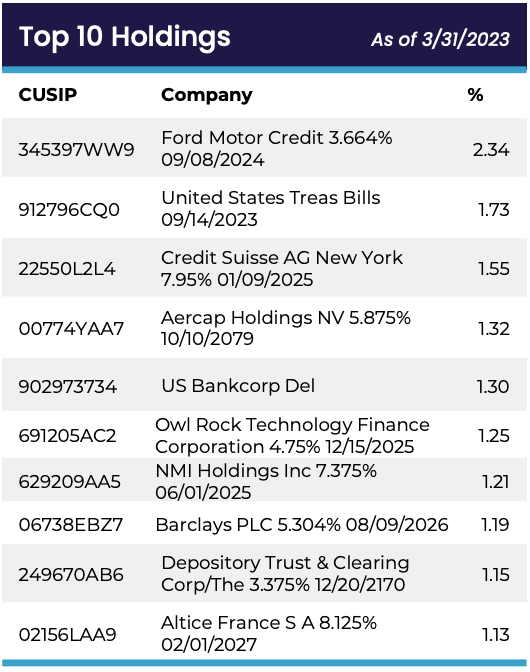
As you can see, the ETF is not over exposed to one single fixed income investment, as the current top holding only accounts for 2.34% of the entire fund, with no other investment accounting for more than 2%.
The top 10 investments account for less than 15% of TGIF as a whole. In totality, the fund owns 181 positions.
The Fund does focus on the financial services sector, but the manager does not focus too heavily on any particular sector as they don’t want to be overly exposed, as such, they aim to keep any particular sector below 25%.
However, once you look at the sector exposure chart below, you will see that the Finance sector has creeped above that 25% threshold, so I would expect that to come down in the next quarter.
The Fund is considered to be non-diversified, which means that it may invest more of its assets in the securities of a single issuer or a smaller number of issuers than if it were a diversified fund.
ETF.com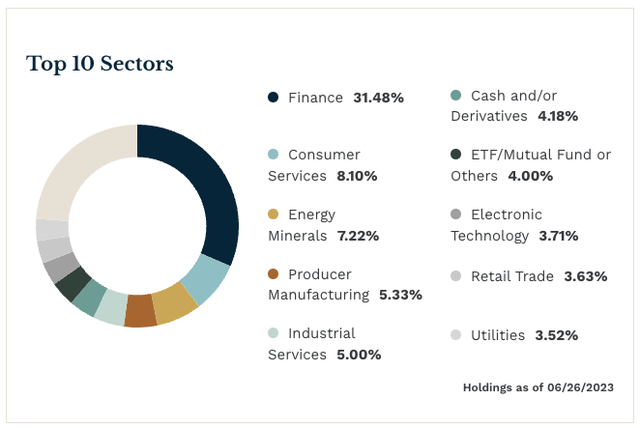
It’s interesting to see that TGIF has 6.2% exposure to the following REIT bonds:
TGIF Investor Presentation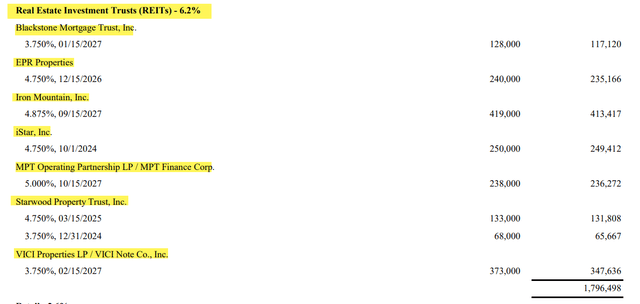
In addition, TGIF has 6.4% exposure to pipelines, 2% exposure to banks, and 6.9% exposure to investment companies.
Weekly Distributions
TGIF as we already mentioned distributed out their payments to investors every Friday, hence the TGIF fund ticker symbol. However, being that the fund is based on income, one would think the yield would be somewhat decent, however, it is rather low in our eyes.
TGIF Investor Website
TGIF currently pays out a distribution of $0.07 per share, every Friday. On an annual basis, TGIF currently pays a distribution of $3.64 per share, which equates to a yield of just 3.9%, rather low.
Over the course of the fund’s first two full years, they did in fact pay a special distribution, which when taken into account would also boost the yield, but given those are not guaranteed or easily calculated, we won’t include them in the yield calculation.
Nasdaq.com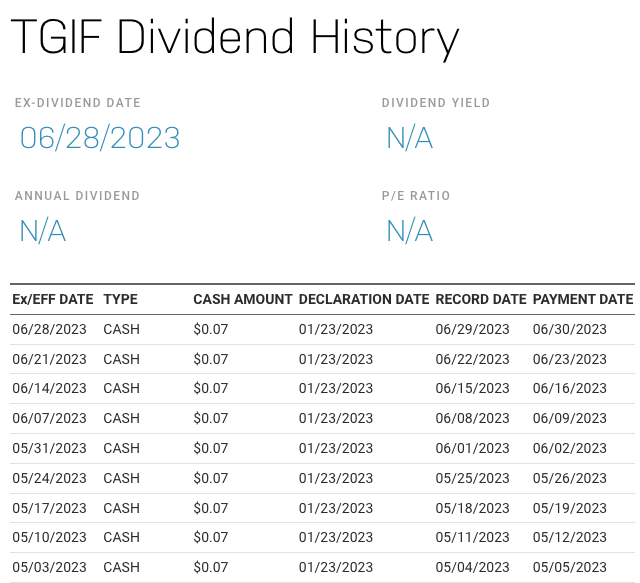
Again, although the concept of a weekly dividend is fascinating, the reality is that the yield is rather low and there may be better alternatives for investors that are searching for higher yield.
What do you think about weekly dividends?
As I mentioned in the WKLY article, “around 3% of WKLY’s holdings are in the real estate sector and TGIF has around 12% exposure to REIT and Pipeline bonds.
As you know, I’m close to launching my own REIT ETF (here’s the Index) and I’m fascinated with the weekly dividends paid by TGIF and WKLY.
To date, we have covered the following ETFs on Seeking Alpha:
I hope that you’re enjoying our ETF coverage at iREIT© on Alpha and I look forward to your feedback.
iREIT© on Alpha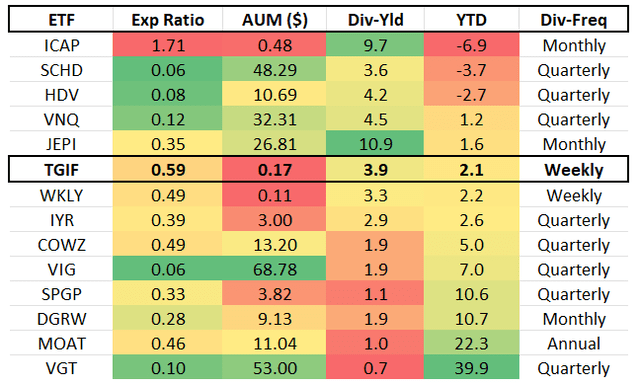
Brad Thomas is a Wall Street writer, which means he’s not always right with his predictions or recommendations. Since that also applies to his grammar, please excuse any typos you may find. Also, this article is free: Written and distributed only to assist in research while providing a forum for second-level thinking.
Read the full article here


