
Originally posted on October 7, 2023
In this weekly market report, we look at the various asset classes, sectors, equity categories, and exchange-traded funds (ETFs) that moved the market higher and the market segments that defied the trend by moving lower.
Identifying the winners and losers allows us to see the direction of significant money flows and their origin.
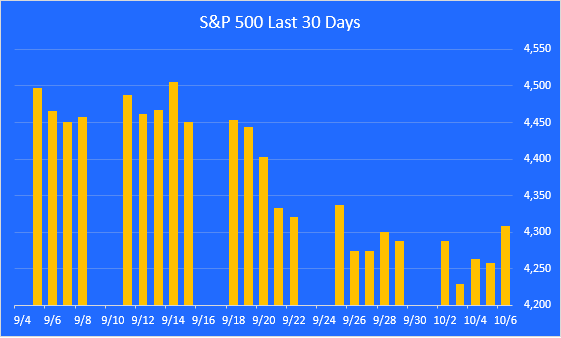
The S&P 500 pullback continues.
For the week, the S&P 500 was up 0.5%. We are now 6.2% below the 2023 high-water mark, set on July 31. The market is still in the process of digesting its gains and grappling with high and rising interest rates.
A look at monthly returns.
This chart shows the monthly returns for the past year. October is off to a positive start, after losing ground in August and September.
ZenInvestor.org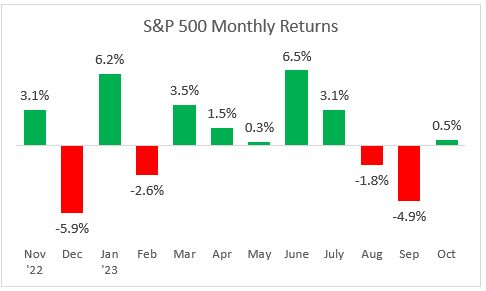
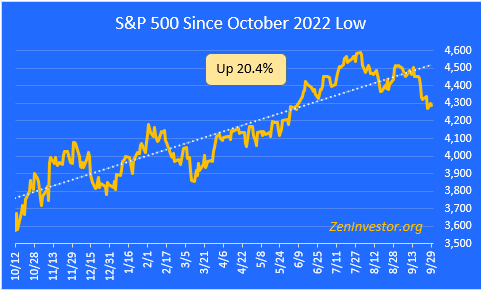
The bull market is well below the trend line.
This chart highlights the 20.4% gain in the S&P 500 from the October 2022 low through Friday’s close. The index is now 10.2% below its record-high close on January 3, 2022.
The Golden Cross.
The market entered a Golden Cross configuration (a Golden Cross occurs when the 50-day moving average crosses above the 200-day) on February 2, 2023.
The spread between these two moving averages is beginning to narrow. Today it stands at 5.0%, twice as wide as the long-term average of 2.3%. This widespread is one of the reasons I’m expecting the current pullback to continue.
Worth mentioning is the fact that the 50-day line is now pointing nose down, which is further evidence of the loss of upward momentum.
ZenInvestor.org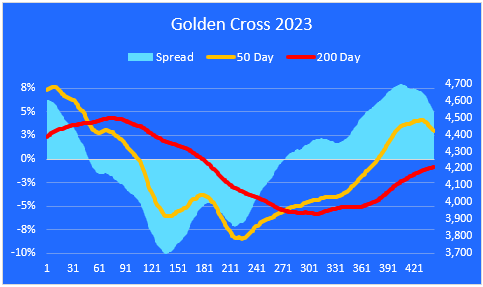
Major asset class performance.
Here is a look at the performance of the major asset classes, sorted by last week’s returns. I also included the year-to-date returns as well as the returns since the October 12, 2022, low for additional context.
The best performer last week was Volatility, as investors were willing to pay higher premiums to hedge their downside risk.
The worst-performing asset class last week was Commodities. Oil is down 10.8% from its recent peak. Precious metals are also down as it becomes more expensive to hold gold and silver.
ZenInvestor.org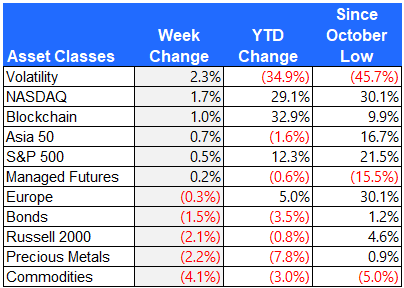
Equity sector performance
For this report, I use the expanded sectors as published by Zacks. They use 16 sectors rather than the standard 11. This gives us added granularity as we survey the winners and losers.
Technology and Communication Services stocks held up the best last week.
Energy, Retail, and Consumer Staples were hardest hit, as higher rates began to bite and summer travel winded down.
ZenInvestor.org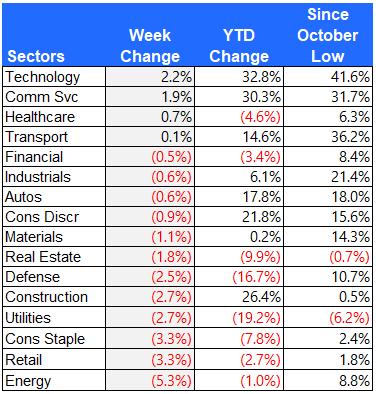
Equity group performance
For the groups, I separate the stocks in the S&P 1500 Composite Index by shared characteristics like growth, value, size, cyclical, defensive, and domestic vs. foreign.
The S&P Top 7 mega-cap tech stocks led the market higher last week. In fact, large-cap stocks were the only winners for the week. Leadership and participation have narrowed once again, which is not a healthy sign for the market.
The worst-performing groups were small- and mid-cap value stocks.
ZenInvestor.org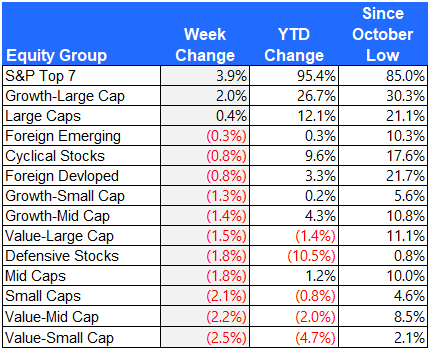
The S&P Top 7
Here is a look at the seven mega-cap stocks that have been leading the market all year. NVIDIA (NVDA) was the biggest winner, up 5.2% for the week.
These seven stocks account for 85% of the total YTD gain in the S&P 500. That’s up from 79% just two weeks ago, providing evidence that participation in the bull market is narrowing once again.
ZenInvestor.org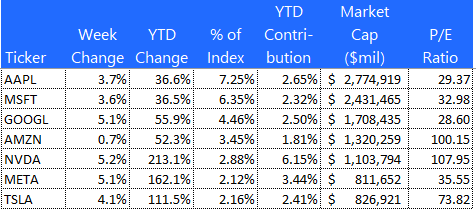
The 10 best-performing ETFs from last week
Bitcoin (BTC-USD) has been rallying this year, but it is still down by 54% from its peak set back in October 2021. Semiconductor stocks were strong, led by Nvidia.
ZenInvestor.org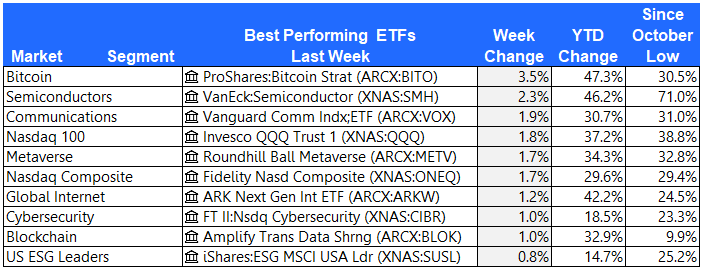
The 10 worst-performing ETFs from last week
After three weeks atop the leader board, Cannabis stocks have given back 22% over the past three weeks.
Five of the ten worst-performing ETFs last week were from the energy sector.
ZenInvestor.org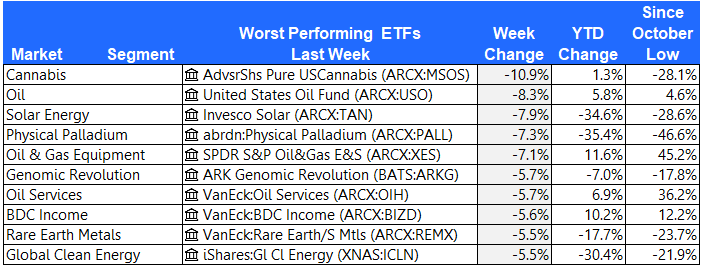
The 10 best-performing stocks from last week
Here are the 10 best-performing stocks in the S&P 1500 last week.
PBI caught a bid after Argus Research raised its price target.
ZenInvestor.org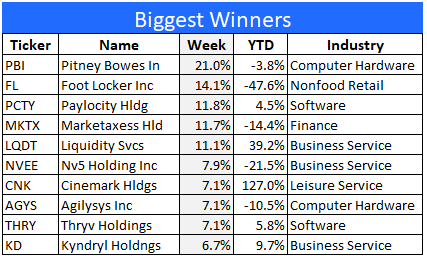
The 10 worst-performing stocks from last week
Here are the 10 worst-performing stocks in the S&P 1500 last week.
Ebix (EBIX) shares tumbled 26% after revenue from co-branded prepaid cards was reclassified.
ZenInvestor.org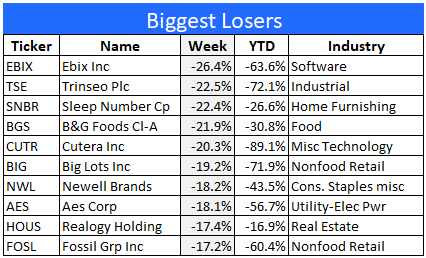
Final thoughts
The S&P Top 7 stocks continue to dominate the market. As the following chart shows, these seven mega-cap tech stocks account for 85% of the S&P 500 YTD gain.
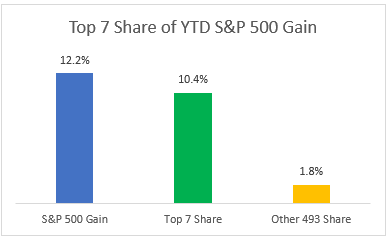
A hypothetical portfolio comprised of these seven stocks, weighted equally, would be up by 91.1% YTD, vs. 12.2% for the S&P 500. The next chart bears this out.
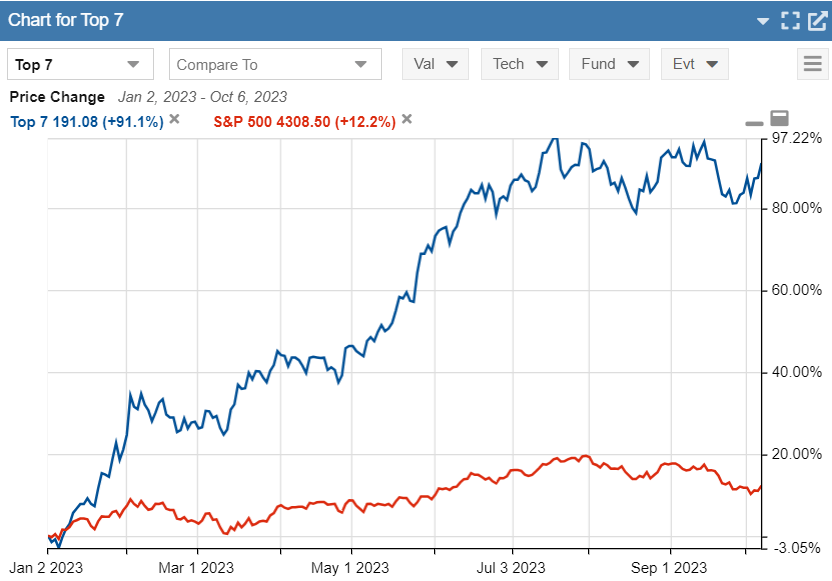
Since the recent market peak on July 31, the S&P 500 is down 6.2% and the Top 7 cohort is down by 2.5%. This tells me that the Top 7 stocks have not “rolled over,” at least not yet. What we’re seeing instead is a market pullback that has broad participation. Put another way, it looks like investors are trimming back their exposure to a broad range of equities, rather than focusing on the more expensive market leaders.
As this pullback continues to play out, I will be paying close attention to what’s happening with the Top 7. For now, at least, they still call the tune.
Are you looking for more high quality ideas? Consider joining The ZenInvestor Top 7, my Marketplace service. The Top 7 is a factor-based trading strategy. Its screening algorithm prioritizes reasonable price first, then the momentum, and finally projected earnings growth. The strategy produces 5-7 names, and rebalances every 4 weeks (13 times per year). The goal is to catch healthy companies that have gone through a rough period, and are now showing signs of making a strong comeback. Join now with a two-week free trial.
Original Post
Editor’s Note: The summary bullets for this article were chosen by Seeking Alpha editors.
Read the full article here

