Current dynamics are reminiscent of the months that preceded the Global Financial Crisis. National savings are in outright contraction while leading economic indicators are signaling an impending contraction in real GDP, yet property and equity prices are still elevated and the consensus view is overwhelmingly for a soft landing. The next decline in equity markets is likely to reveal the extent of the economy’s weak foundations, and the combination of record debt and asset valuations suggests the risks of another financial crisis are high and rising.
Leading Indicators Point To A Deep Recession
The recovery in risk assets and improvement in macro data over the past few months has reduced fears of a recession. The probability of a recession being declared over the next 12 months has fallen from 65% to 60% according to the latest Bloomberg survey of Wall Street analysts, which is around where it was in early 2008 when we now know the economy was already in contraction. Last month Goldman Sachs Chief Economist Jan Hatzius reduced the company’s recession probability over the next 12 months to just 20% on the back of the improvement in data. From where I sit, the leading indicators paint an unequivocally negative picture.
US 2-10 Yield Spread And US Recessions (Bloomberg, NBER)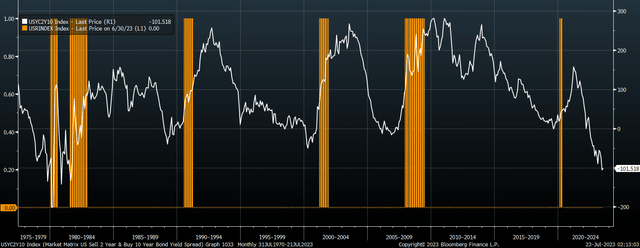
The yield curve is a long leading indicator in that periods of curve inversion, where long-term yields fall below short-term yields tend to occur at least a year before the economy officially enters recession. The logic behind this indicator is fairly straightforward. As the Fed hikes interest rates to cool inflation, bond investors anticipate that sharp rises in rates will be temporary. Usually, the recession has already begun by the time the Fed cuts rates, which causes the yield curve to rise sharply once it arrives. With the curve inversion now its deepest since the early 1980’s the collective wisdom of the bond market implies that the recession will be equally as large.
LEI Vs US Recessions (Bloomberg, NBER, Conference Board)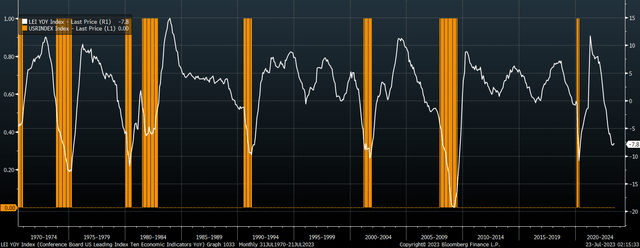
The US yield curve is a component of the Conference Board’s Leading Economic Indicator index, which measures 10 component – 3 financial indicators and 7 macroeconomic indicators – that aim to provide an early indication of significant turning points in the business cycle and where the economy is heading in the near term.
US Leading Indicator Index Vs Real GDP Growth (Bloomberg, BEA, Conference Board)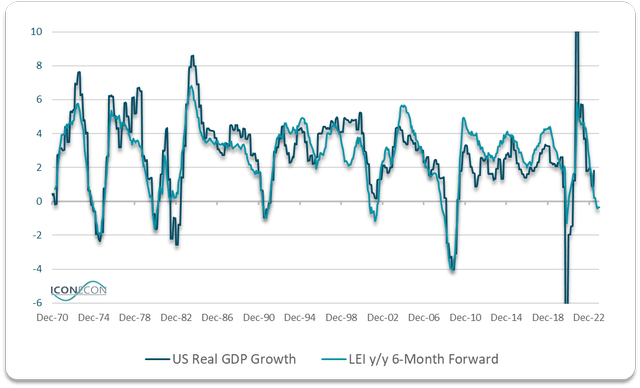
The June LEI came in at -7.8% which is a figure that has never been seen outside of official recession. Based on its correlation with subsequent real GDP growth, this suggests we will see an outright contraction in real GDP by end-2023.
US Real Net Savings Vs Recessions (Bloomberg, NBER, BEA)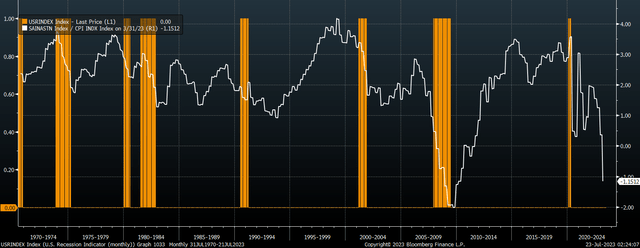
One of the most underappreciated and informative indicators of the health of the US economy is the net national savings rate. While most economists focus on the personal savings rate, the economy-wide savings rate gives a picture of the amount of overall real wealth that the US economy is creating after subtracting consumption and depreciation expenses from total output. Recessions are usually preceded by a sharp drop in wealth creation even as the economy continues to expand, as the economy ‘eats its seed corn’ by drawing down savings to fuel consumption. While the latest data available is for Q1, real US wealth actually contracted for the first time since the height of the Global Financial Crisis.
Asset Market Weakness Could Turn A Recession Into A Financial Crisis
The key difference between a mild contraction and the kind of self-reinforcing wealth destruction that characterized the Global Financial Crisis is the level of debt in the economy and the valuation of asset prices. The greater the level of debt and asset prices relative to the size of the real economy, the greater the likelihood that falling real output triggers sharp declines in asset prices and perceived wealth, which further undermine real economic output. With both US equity and housing valuations at their most extreme levels ever and total debt to GDP still beyond any levels seen outside of the Covid crash, the risk of another financial crisis is high and rising.
US Total Debt/GDP, Real House Price Index, SPX/GDP, Rebased to 1970 (Bloomberg, NBER, BEA)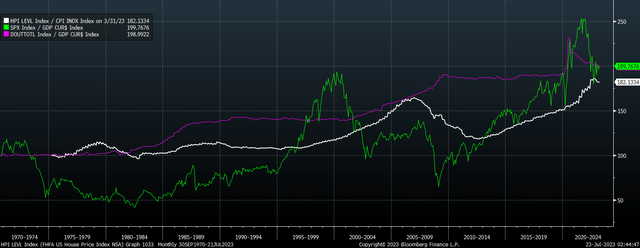
Note that in the absence of any declines in asset prices in 2008/09, the real economy would still have likely suffered a recession. The real cost of the physical resources required to sustain the investment boom would have been forced to rise to reflect the decline in national savings that left the US economy extremely reliant on foreign savings via its current account deficit. Even without any decline in property prices or consumer confidence, the construction industry would have suffered a decline in profitability due to rising costs, resulting in falling investment spending and a recession.
The sharp asset price declines merely expedited and intensified the recession by driving down consumer confidence and widening the gap between consumer demand and business production plans. Rising corporate borrowing costs also further negatively impacted the ability of businesses to readjust investment to meet the real availability of savings in the economy and consumer preferences. This time around the downside potential for asset price declines is even greater.
The Collapse In Tech Earnings Could Be The Canary In The Coalmine
For now, the property market is holding up as effective mortgage rates are still low, which means that the negative wealth effect from falling property prices will take longer to arrive this time around. However, the construction sector is not the only one that has experienced an unsustainable boom. Tech sector spending has surged since the pandemic, with IT equipment, software, and R&D now making up half of total US investment.
Yardeni.com, BEA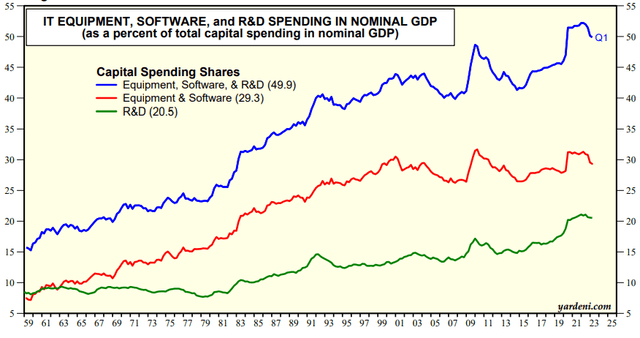
This surge in IT investment has come at the cost of collapsing earnings, with Nasdaq 100 earnings down 24% from last year’s peak. The relatively strong performance of mega-cap earnings belies the picture for the average company, where median NDX 100 earnings are now down 41% from their peak. Surging capex and collapsing earnings are a recipe for a downturn in the industry, and considering how overvalued tech stocks have become, this sector could lead the downturn.
NDX and NDXE EPS (Bloomberg)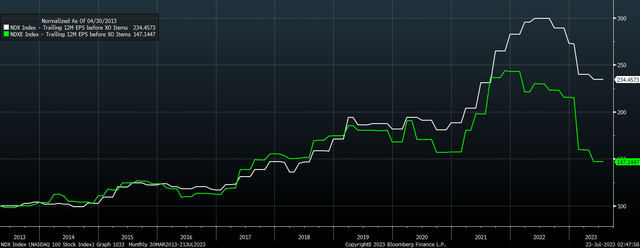
Read the full article here

