Thesis
When the pandemic first caused a shift in buying habits, some retailers began experiencing abnormally large revenue and high returns. While many of those same companies have since been experiencing a normalizing of their demand, Tractor Supply Company (NASDAQ:TSCO) appears to be experiencing continued revenue increases. After looking over their financials and valuation, I presently rate Tractor Supply Company as a Hold.
Company Background
Tractor Supply Company is a retailer of products for agriculture, lawn and garden maintenance, home improvement, livestock, and equine and pet care. The company was originally founded by Charles Schmidt in Chicago in 1938 as a mail-order catalog. In 1939 they opened their first retail store in Minot, North Dakota. They are currently headquartered in Brentwood, Tennessee, and operate roughly 2000 stores and an online storefront. The company is projecting additional improvements to revenue, margins, and income.
TSCO Guidance (Q1 2023 Investor Presentation)
Long-Term Trends
The E-Commerce Agricultural Products market is projected to grow at a CAGR of 6.91% through 2025; and the Agriculture market the company serves is expected to grow at a CAGR of 2.81% through 2028. The Lawn and Garden market is projected to experience a CAGR of 2.64% through 2028. The Home Improvement market is projected to have a CAGR of 6.4% until 2028. The Livestock Care & Treatment market is expected to have a CAGR of 7.6% through 2030. The United States Pet market size is projected to experience a CAGR of 5.06% through 2028, and globally Pet Care is expected to have a CAGR of 5.92% until 2030.
Annual Financials
Even before the pandemic, Tractor supply company was experiencing steadily increasing revenue. From 2013 through 2019 the company experienced annual revenue increases in the 6-10.5% range. After revenue inflected upward, it experienced annual increases in the 11.5-27% range.
TSCO Annual Revenue (By Author)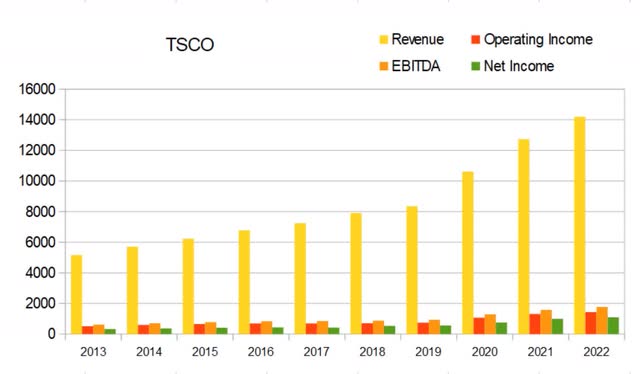
They have extremely stable margins. Gross margins typically fall between 34% and 35.4%. The company experienced a shallow contraction in operating margins which found a bottom of 8.87% in 2018 before stabilizing back into its normal 10.1% to 10.45% range. The gap between net margins and operating margins is noticeably smaller in more recent years than previous ones. This is a clear indication they have experienced improvements in efficiency. As of the most recent annual report gross margins were 35.0%, operating margins were 10.1%, and net margins were at 7.66%.
TSCO Annual Margins (By Author)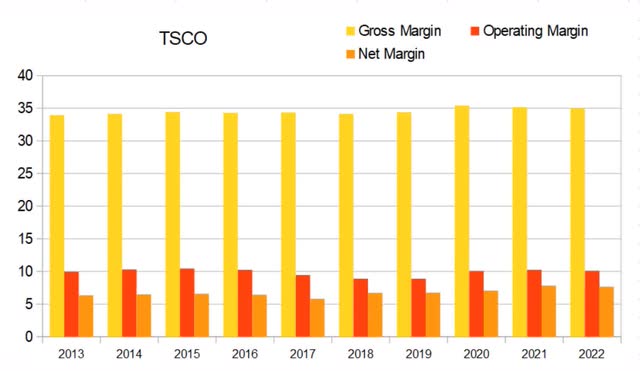
The company has been steadily buying back shares. Total common shares outstanding was at 139.7M in 2013; by the end of 2022 that fell to 110.3M. This represents a 21.04% decline in share count. Over that same time period operating income rose from $514.7M to $1,434.9M, a 178.8% rise.
TSCO Annual Share Count vs. Cash vs. Income (By Author)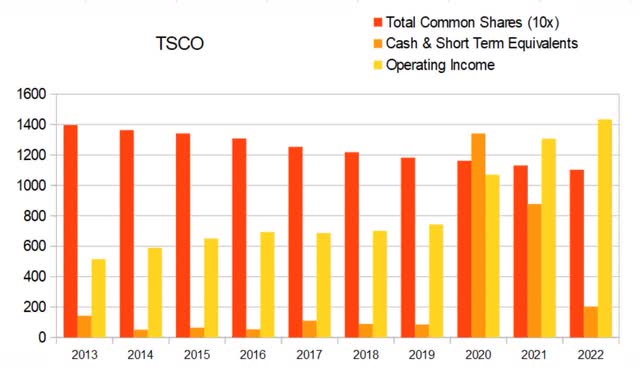
Many companies attempt to cancel out their interest expenses by making investments. Tractor Supply Company does not. However, they do keep their net interest expense quite low when compared to their operating income.
TSCO Annual Net Interest Expense (By Author)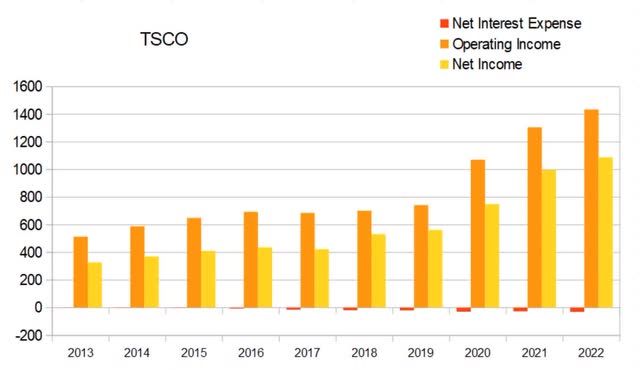
I usually treat annual debt to income ratios above 3x as unappealing, and ratios below 1x as appealing. Until 2018, Tractor Supply Company kept their debt levels extremely low. In 2019, the company entered into a capital lease agreement. Total debt rose dramatically, but has since been falling. Considering what their revenue and operating income have done since then, they appear to have deployed this additional capital effectively. As of the most recent annual report total debt to operating income was 2.98x, and long-term debt to operating income was 0.81x.
TSCO Annual Debt vs. Income (By Author)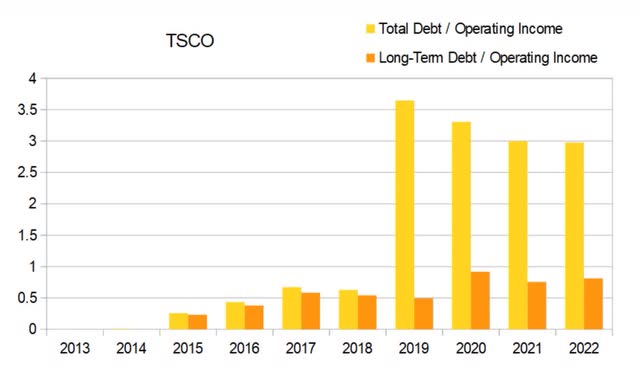
The effects of the capital lease also show up on their total equity chart. Liabilities and assets both rose significantly in 2019, and have continued rising since then. Total equity experienced a noticeable jump from 2019 to 2020, but has been steadily climbing otherwise.
TSCO Annual Total Equity (By Author)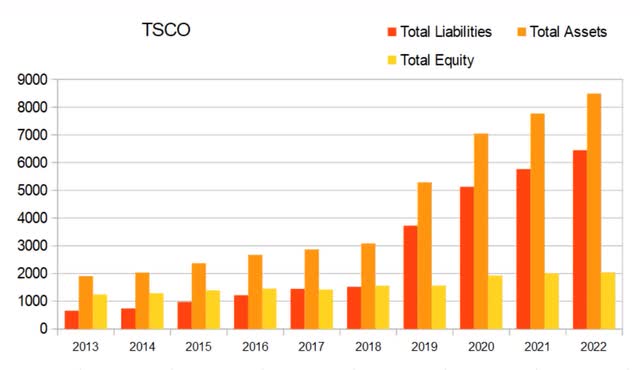
Their returns are attractive. Up until 2018 they were consistently producing returns in the 20% to 30% range. When they entered into the capital lease they also filled their war chest with cash. This has been warping their three return values. Many investors prefer to only look at return on invested capital as a measure of efficiency. When the company carried both higher debt and cash, their ROIC values were no longer producing an accurate representation of their long-term operating efficiency. I prefer to look at all three for this very reason.
As cash levels have normalized, annual ROIC has trended back toward 20%. However, it has yet to reach its previous range in the mid 20’s. As of the most recent annual report ROIC was 17.25%, ROCE was 26.65%, and ROE was at 53.3%.
TSCO Annual Returns (By Author)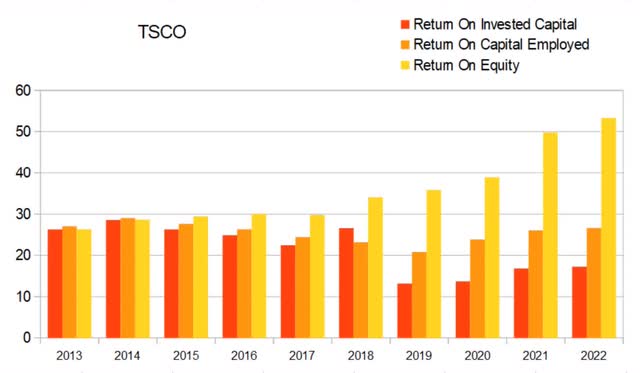
Quarterly Financials
Their quarterly financials are showing clear seasonality. The company seems to experience better than average revenue and income every Q2. The company also appears to experience lower than average revenue and income every Q1. Considering the products the company sells, it makes perfect sense for them to experience lower revenue every winter, and then higher revenue every spring.
TSCO Quarterly Revenue (By Author)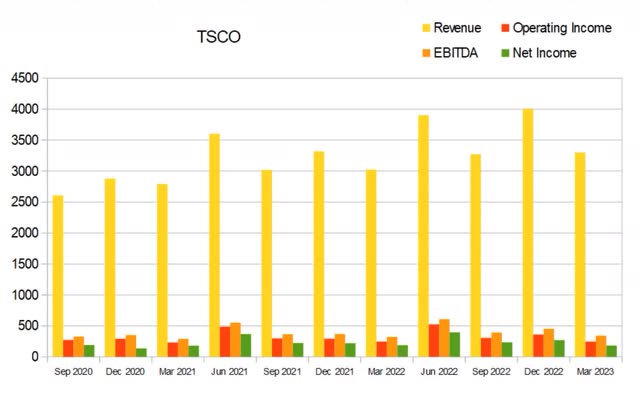
The same seasonality that affects their revenue and income also shows up in their quarterly margins. As of the most recent quarter gross margins were 41.33%, operating margins were 7.41%, and net margins were at 5.55%.
TSCO Quarterly Margins (By Author)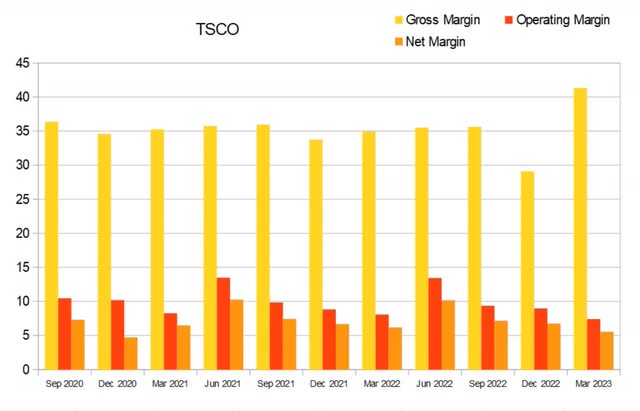
As of the most recent quarter cash and equivalents was $190.1M, and quarterly operating income was $244.4M.
TSCO Quarterly Share Count vs. Cash vs. Income (By Author)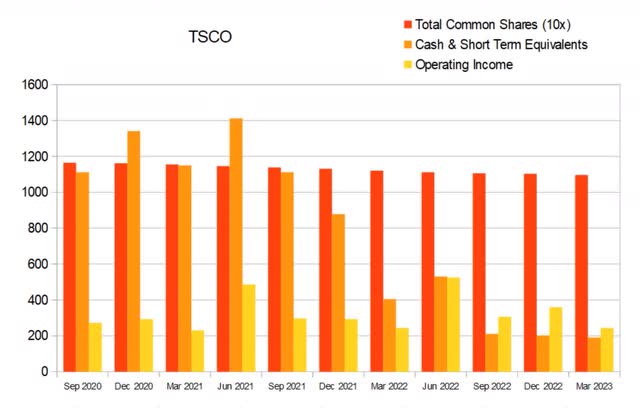
Their buyback rate also experiences seasonality. This is a clear indication the company is varying its buying back rate with income, instead of buying back a flat amount every quarter. The sum of their last four quarters of buybacks comes to 2.16%.
TSCO Quarterly Buyback Rate (By Author)
Their quarterly net interest expense has been rising, but it is still far from concerning. The most recent quarter’s $12.7M in interest expense was still dwarfed by their $244.4M in operating income and $183.1M in net income.
TSCO Quarterly Net Interest Expense (By Author)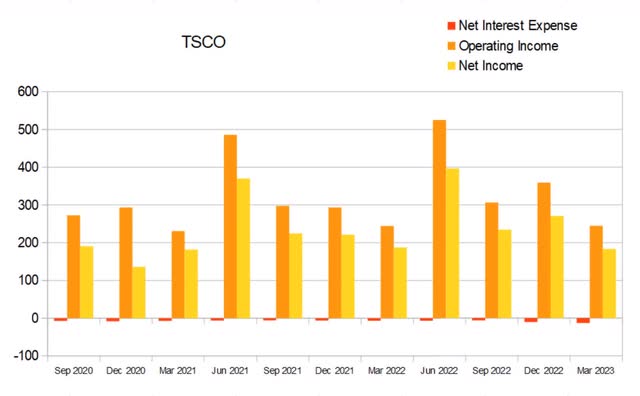
When viewing debt to income ratios on a quarterly basis, I shift my thresholds from 1x and 3x, to 4x and 12x. The effect seasonality has on their operating income produces significant variance in their quarterly debt to income ratios. The most recent quarter took place during the part of the cycle where these values are the least attractive. As of the most recent earnings report total debt to quarterly income was 19.25x while long-term was 6.55x.
TSCO Quarterly Debt vs. Income (By Author)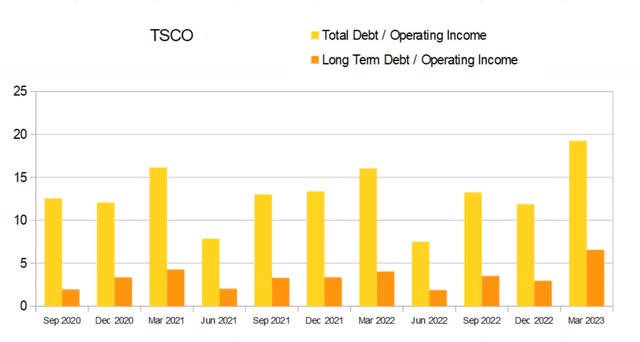
Although their assets and liabilities have both been rising, total equity remains fairly flat.
TSCO Quarterly Total Equity (By Author)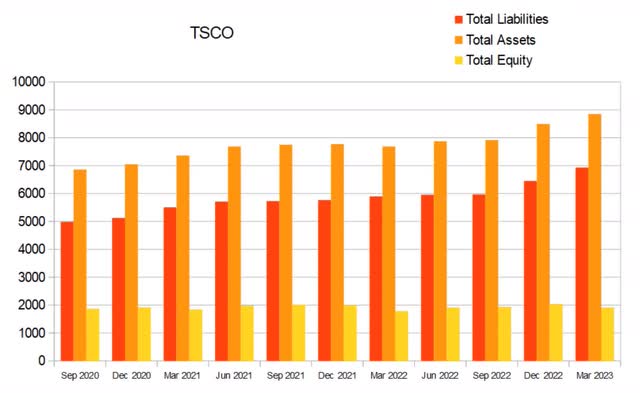
Their quarterly returns are strong. As with their debt to income ratios, this most recent earnings report landed on the part of its annual cycle where these values are the least attractive. I typically consider quarterly returns above 2.4% to be attractive. As of the most recent earnings report quarterly ROIC was 2.77%, ROCE was 4.25%, and ROE was 9.56%.
TSCO Quarterly Returns (By Author)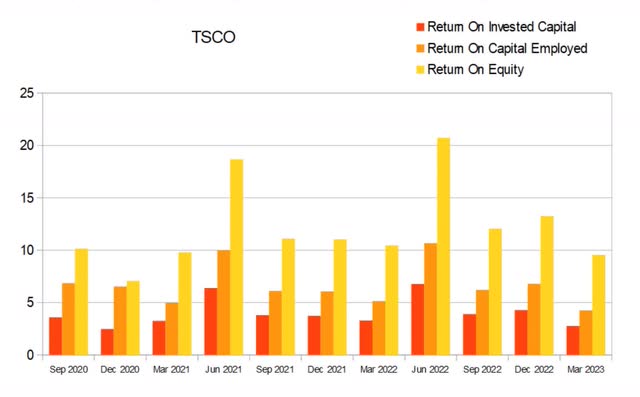
Valuation
As of June 20th, 2023, Tractor Supply Company had a market capitalization of $23.99B and traded for $217.01 per share. Even considering their annual ROIC of 17.25%, I view their forward P/E of 20.87x, EV/EBIT of 18.48x, and Price/Cash Flow of 15.21x as showing the company is presently overvalued.
TSCO Valuation (By Author)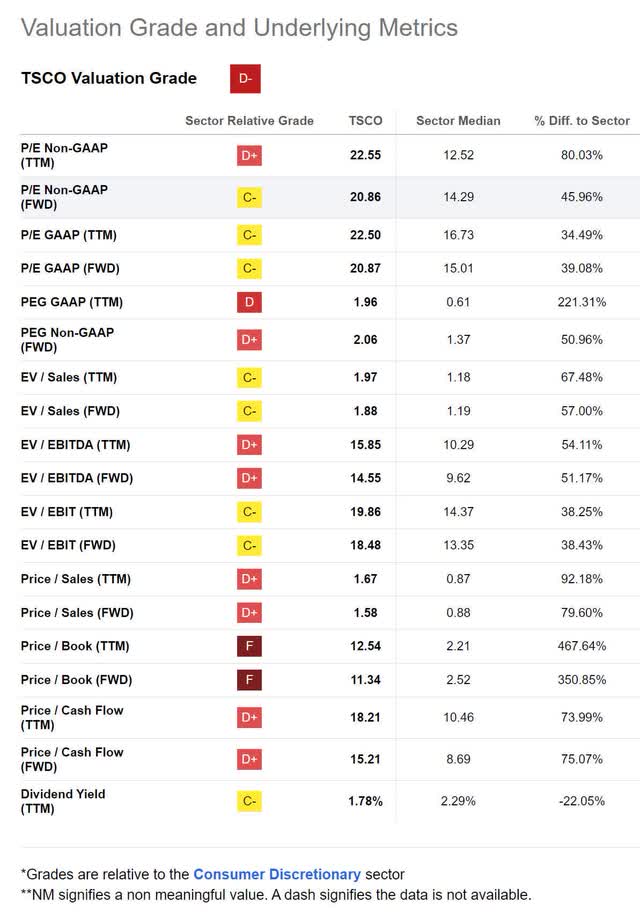
Using their annual dividend of $4.12 per share, a discount rate of 9%, their 10-year dividend CAGR of 24.67%, and assuming they can maintain this dividend growth for 20 years, a discounted cash flow calculator produces a fair value estimate of $1,120.38 per share.
The dividend growth rate has actually shifted to values well above a 25% in more recent years. The company is currently buying back shares at a rate of 2.16% per year. I calculated an average annual revenue growth rate of 19.53% over the last three years. However, Seeking Alpha is showing a projected forward revenue growth of only 8.43%, and the company is already at a payout ratio of 39.03%. Unless one is expecting a significant margin expansion, it’s fair to assume that their projected dividend growth rate of 29.38% cannot be indefinitely maintained above the combination of their revenue growth rate plus buyback rate. Although I don’t know when, I believe the aggressively steep slope their dividend history has assumed over the last 3 years will eventually be forced to inflect into one that is more shallow.
TSCO Dividend and Price History (Seeking Alpha)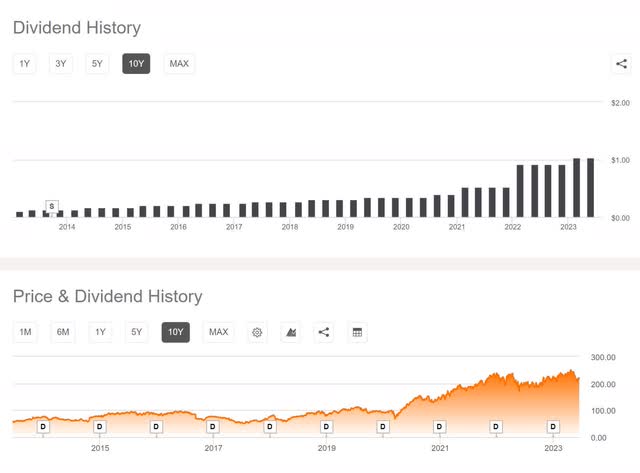
Using their forward P/E of 20.87x, their Diluted EPS Growth of 10.26%, and their Yield of 1.88%, I calculated a PEGY of 1.72x and an Inverted PEGY of 0.58x. As the PEGY value is above 1, it falls in line with my assessment of the other valuation metrics that the company is presently overvalued.
TSCO PEGY Valuation (By Author)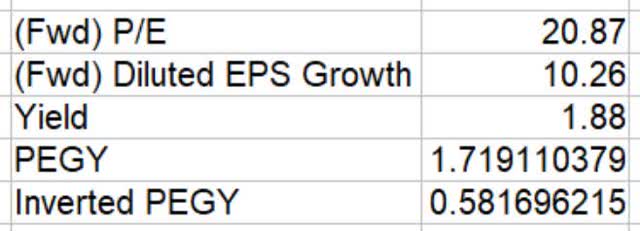
Risks
Tractor Supply Company faces some overlap in their products from a variety of other retailers. They compete against everyone from hardware and home improvement stores, to pet stores and lawn & garden supply stores. They even sell clothes. However, a small portion of their items can be difficult to find in most other stores. They carry welding equipment, hydraulic and pneumatic equipment, cattle feed bins, chicken and game bird feed, as well as medicine for horses and birds. If you walk in there during the right time of year, you will find varieties of baby chicks, bunnies, and sometimes ducklings or other fowl. Very few businesses have similar enough business models that they truly compete with Tractor Supply Company. Off the top of my head, I can think of Rural King, which is not publicly traded, but sells many of the same types of products.
Catalysts
With the company already benefiting from the shift in buying habits caused by the pandemic, I view every earnings report as a catalyst. The remaining question revolves around how much of the behavioral shift is permanent and how many consumers will shift back. While selling feed, grit, feeders, and chicks is only a small slice of the business, it’s one that doesn’t typically face pressure from Lowe’s, Home Depot, or local hardware stores. While it’s hard to try and make an assessment of the aggregate buying habits for the entire business, I can look at the price of eggs as an indicator. With the grocery store prices dropping but still quite elevated, I believe the trend of keeping chickens at home is unlikely to wane quickly. A big part of this is because once one makes an investment into learning how to care for chickens, it’s quite easy to keep doing so. Also, it’s a major factor that many people prefer the taste of free range eggs over factory raised. Between the cost savings and the perceived taste difference, consumers who have experience owning chickens are likely to consider grocery store eggs a downgrade.
First Hand Experiences
I have been into lapidary as a hobby for many years now and this company is the only store in my area that carries the mineral oil I need for my slab saw. Whenever I visit the store, the overall tone of the stores is always friendly and the employees there are always helpful. Several years ago, I got to know one of the managers after they started taking classes at the school that I teach, and found out the company was paying for most of his education. The overall impression that I get is that this company actually cares about the well-being of its employees. Happy employees tend to produce happy customers, and hopefully this translates to happy investors.
Conclusion
Overall this appears to be a fantastic company with a bright future. The only problem is it presently appears overvalued. I fully understand that one should be willing to pay more for companies that consistently maintain high returns. However, when buying an asset which is already overvalued, ones likelihood of achieving out-sized returns goes down significantly. While we cannot control what happens to the price of an asset after we buy, we can control when and what we buy. The larger our margin of safety, the greater chances the potential long-term compounder with high returns we invested into ends up becoming a multibagger. As much as this is a fantastic company, and believe it will continue to produce attractive returns, I am not willing to buy it unless it’s undervalued. It is however, worth adding to my list of companies worth buying if they ever become cheap enough.
Read the full article here


