
Investment briefing
Consumer and electronics (“C+E”) retailers are primed to perform given a spate of macroeconomic crosscurrents positively inflecting the sector. The C+E business is marked by narrow product differentiation between players and a push towards cost leadership. This means tight margins, but, for high-performing names, fast turnover of capital, capital efficiency, and quick cash conversion.
Upbound Group (NASDAQ:UPBD) presents as one such name having come onto our radars in H2 FY’23. The company has done well considering the market/economy this year, and its stock returns reflect this well.
As a reminder, UPBD is in the lease-to-own business and operates in the U.S., Puerto Rico, and Mexico. The company’s lease-purchase agreements allow customers to own a suite of selective products without incurring long-term debt.
For example, its Rent-A-Center (“RAC”) business leases furniture, appliances, electronics, and so forth under lease-to-own agreements. It has ~1,800 locations in its core markets. Additionally, the Acima business provides lease-to-own solutions to retailers in-store and online, helping them to broaden their customer base and increase sales. It has a number of additional brands under its wing, each aimed at driving sales at retail stores, from furniture to electronics.
On my examination, UPBD presents with a number of differentiated characteristics:
- Its lease-to-own model provides customers the ability to scale up ‘purchases’ without hindering purchasing power,
- Positioning in furniture, appliances, and computers/electronics gives scope to retailers across the spectrum of operations,
- Leasing is an alternative solution to owning and therefore reduces the burden of upfront costs for customers, attractive in the current market,
- Combination of e-commerce and brick + mortar presence increases the share of mind for consumers, and potentially, the ‘wallet share’ as well.
There are other factors in this list that will be discussed in further detail here today.
The company put up Q2 revenues of $979mm, down ~8.5% YoY, on adj. EBITDA of $130mm and earnings of $1.11/share. Growth was observed across its core portfolio, and it printed FCF of ~$25mm, declaring dividends of $0.34/share in the process. Management forecasts ~$4Bn in sales this year, expecting $465mm in adj. EBITDA and earnings of $3.55/share, both at the upper end of range.
Net-net, I rate UPBD a buy from the factors raised in this report, eyeing $55 as a long-term price target.
Figure 1.
Data: Updata
Critical facts pattern supporting buy rating
1. Price-implied expectations
The stock sells at ~8.4x forward earnings and ~15x forward EBIT on a market cap of $1.61Bn and EV of $3.06Bn. At these multiples, the market expects $3.44/share in FY’23 earnings (28.76/8.4 = 3.44) and $200.4mm in EBIT (3006/15 = 200.4). It therefore expects ~7% decline in earnings and 9.3% YoY growth in pre-tax income.
The company also trades at 3.12x EV/invested capital, a premium of 2.12x on its investments. Comparing the business returns of 14.5% on capital deployed (discussed later) to our 12% threshold rate of return, the economic value of its investments is 1.2x multiple. The market implied ROIC (1/(EV/IC)xROIC) is therefore 4.7% going forward.
As a result, we can obtain what the market expects UPBD to reinvest into the business and its projections on intrinsic growth, using the function of growth, ROIC, and investment (RI = g/ROIC). At the 9.2% pre-tax growth rate, and 4.7% implied ROIC, it looks as if investors expect the firm to reinvest ~50% of pre-tax earnings, or ~$100mm. It therefore projects the company to grow its intrinsic value at (4.7%x50% = 2.4%).
Based on consensus estimates from FY’23–’25, and market implied growth rates:
- The required rate of return for investors to buy UPBD and be compensated fairly is ~11%, ranging from 9.3–20% based on various stipulations,
- This suggests a moderate level of risk is priced into UPBD’s market value, and that investors are likely to be happy paying the 8.4x multiple in my view.
BIG Insights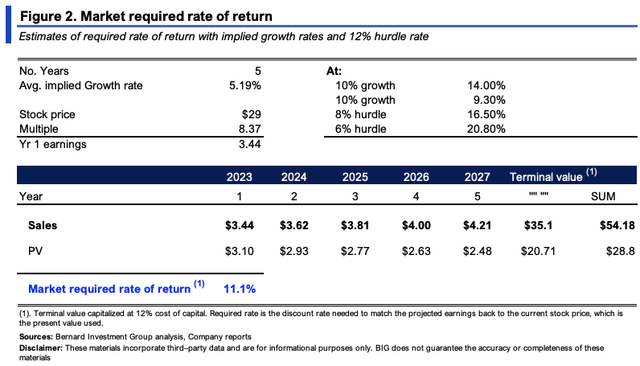
2. Factors confirming/negating market expectations
There are economic and technical factors that are both at odds and confirm the price implied expectations.
Management is crystal clear on its use of cash for this year:
Regarding capital allocation…Top priorities for 2023 continue to be reinvestment in the business, dividend payment and debt reduction. During the second quarter, we paid down $90 million that has been outstanding on our ABL facility and ended the quarter with zero balance.
Economically speaking, UPBD presents with attractive economics that feed into its competitive position.
In particular, on what assets are employed on the balance sheet, it rotates back $0.78 in gross per $1 in assets, as seen in Figure 3a. This is considered to be exceptional in real terms ($0.3 on the dollar is ‘good’). Around 78% of all assets are recognized in gross profit, therefore.
BIG Insights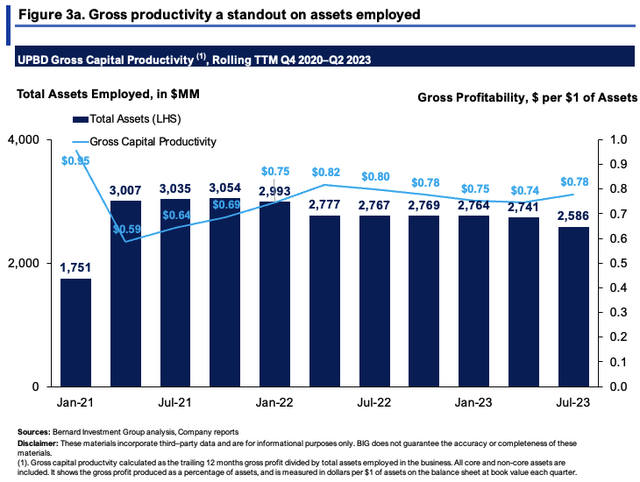
What’s essential to this analysis of UPBD is understanding the cash flows in year A, observing where they end up in years B and C+, and what’s made of them. To that effect:
- It had $17.20/share of capital invested in the business in Q2, up from $5.28/share in 2020. This produced $2.50/share in TTM NOPAT, down on recent periods, but still a 14.5% return on investment.
- Driving UPBD’s business returns is the ratio of sales to capital employed in the business. This is a low-margin, high capital turnover company, with single-digit post-tax margins and capital turns of ~4.2x last period. This is in line with its averages.
- This tells me it enjoys production advantages and likely employs a cost leadership strategy, pricing its offerings below industry averages. This is absolutely critical, as:
- There are no consumer or differentiation advantages enjoyed in this industry.
- This enables UPBD to differentiate on cost and get more products out the door, adding economic value to its leasing model.
So each $1 of investment draws in ~$4.20 in sales and $0.04 in profit, but UPBD still spins off plenty of cash to its owners—$6.50/share last period, including all buybacks and dividends paid up.
BIG Insights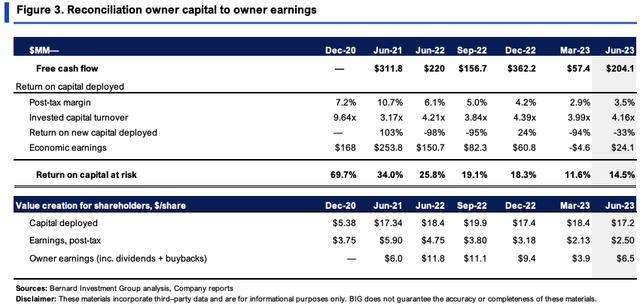
Another advantage—UPBD enjoys benefits of negative working capital, due to its operating model. It receives payments up front (under leases) before it needs to pay any suppliers/purveyors. This is tremendously attractive, enabling the use of cash before any future commitments.
Point being, if it does another 14% return on investment, already we’re ahead of the market’s expectations. What conviction is there it could do this. Turn to Figure 4 for guidance:
(i). In the last 3 years, each new $1 in sales required $0.38 of investment, $0.56 with all M&A.
(ii). The bulk of investment was to intangibles + fixed capital, and it managed to reduce NWC intensity by ~$0.02 on the dollar.
So if it maintains this level of steady-state operations (even with 2% NWC per $1 of sales growth) it could throw off $195–$222mm in annual FCF and produce up to 23% return on existing capital, reinvesting just 22% of earnings each period. Clear divergence from the market’s expectations.
BIG Insights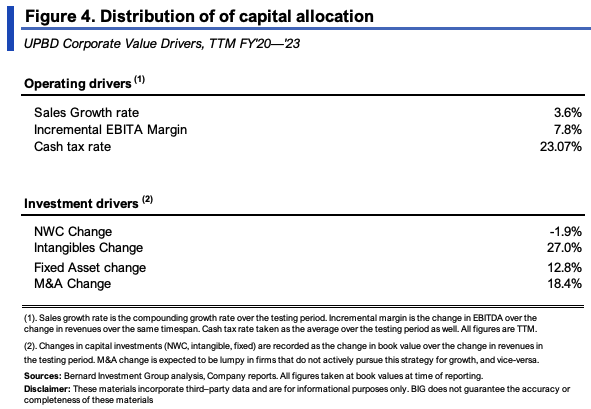
Technicals are mixed for UPBD as we speak. For one, the market profile of the company’s price action from Q1–Q3 indicates an area of high usage from the $28–$31 region. This shows price has spent the bulk of time in this zone, a factor the market has already rectified, as markets tend to move from areas of high to low usage. There are two potential outcomes from this in my view:
- The rest of the distribution in the $28–$31 region is filled, keeping UPBD in this trading range,
- Investors seek to fill the upper bound of the broad distribution (shown in Figure 5), which could see it run to the $33 region.
This is critical information to carry for price visibility moving forward.
Figure 5.
Data: Updata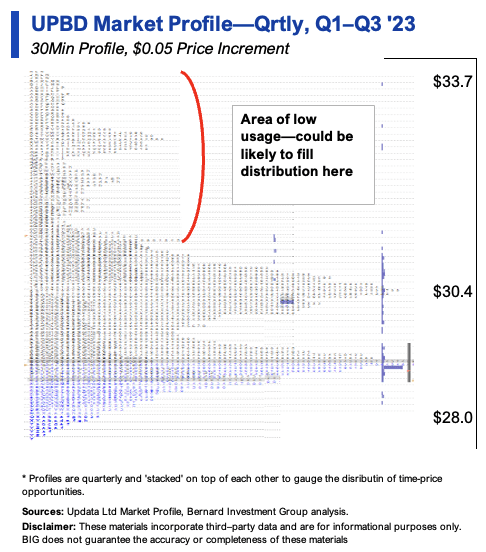
Trend action isn’t quite as constructive. On the daily cloud chart, price and lagging lines are beneath the cloud, having both crossed the base in August. Critically, the cloud top is at the $32–$33 mark, which aligns with the market profile’s low usage area. A break to this region would therefore be significant.
On the weekly chart, it is best summarized in the following:
- Price line above the cloud, a lagging line pushing into the cloud body. Needs a break above $33 to turn ‘full’ bullish.
- Price line looking to test cloud top at $26.00, which could mean it would fill the remaining distribution of the high usage area described earlier.
These factors balance the investment debate somewhat and should also be considered.
Figure 6. Daily chart—looking to the coming weeks
Data: Updata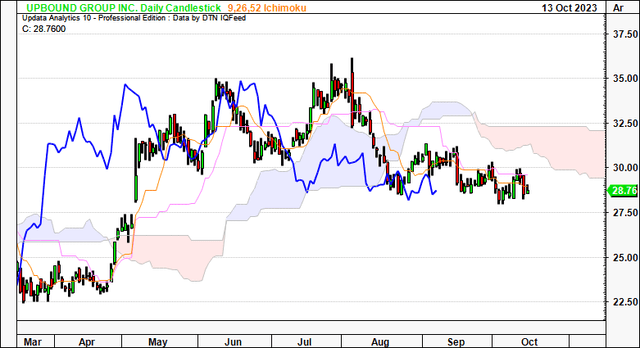
Figure 7. Weekly chart—looking to coming months
Data: Updata
What’s interesting is this:
- We have upside targets of $32.00 on the point and figure studies below.
- This corroborates the low usage area outlined earlier and should be considered in my view.
- Hence, I am looking to $32 as the next price objective but need the trend action to support this notion in the short term.
Figure 8. Upsides to $32, corroborating with the low-usage area in Figure 5.
Data: Updata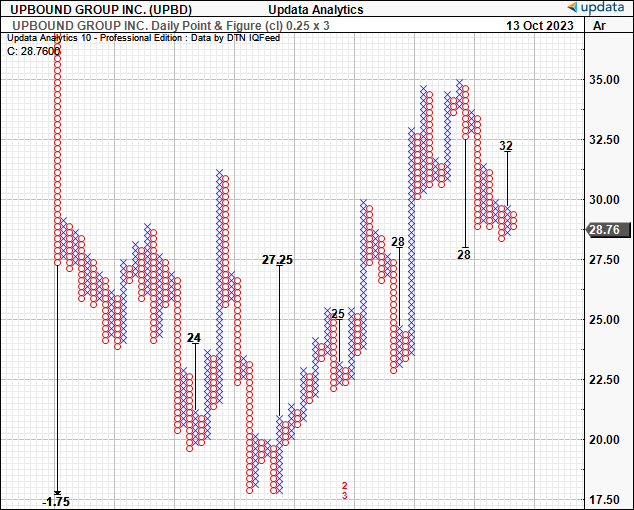
3. Valuation
As mentioned, UPBD currently sells at 8.4x forward earnings and 15x forward EBIT. To me, this seems like good value, based on the following:
(i). Projecting the steady-state numbers in Figure 4 out to FY’28, then discounting at our 12% threshold margin gets me $54/share, and $47/share in the downside scenario. Around half of the value is realized in the, around 1/2 in the continuing value period beyond FY’28.
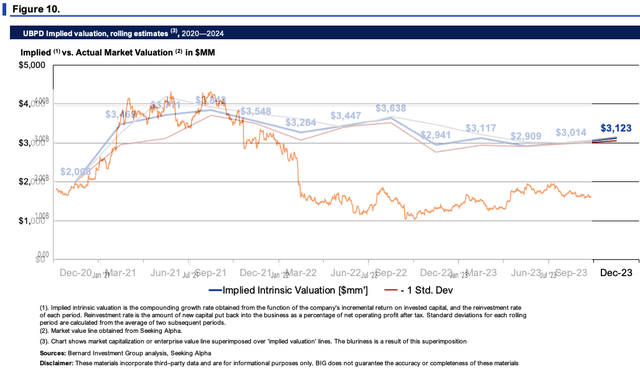
(ii). Compounding its intrinsic value at the function of its ROIC and reinvestment rate suggests the market may be under-appreciating its ability to compound value. The calculus shown in Figure 10 has the company valued at $56/share, in range with that of (ii).
(iii). This outpaces the market’s required rate of return from earlier.
In that vein, I’m looking to the next target of $32, then would be eyeing a range of ~$55/share over the longer term.
BIG Insights BIG Insights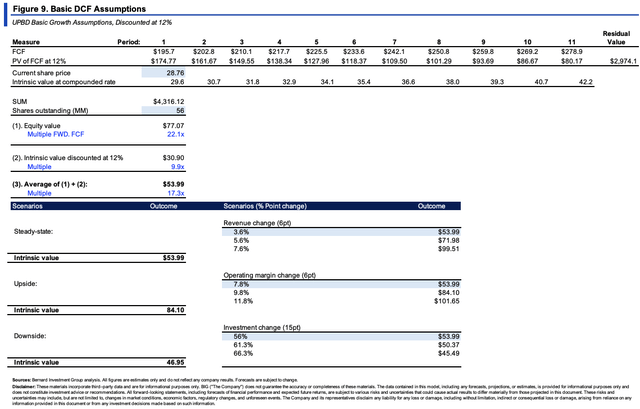
Discussion summary
Based on the comparison of (i) price-implied expectations from the market, and (ii) UPBD’s prospects in business returns and intrinsic value, my estimation is there is potential for a change in expectations, and, therefore market pricing, in the coming periods.
UPBD enjoys cost leadership advantages, has negative working capital (freeing up cash flow), and turns over capital at attractive rates. These are attractive economics that see it reinvest cash flows above our 12% threshold margin.
The key risks are:
- Complete downside surprise at its next set of earnings,
- Market technicals dominating, continuing the longer-term downtrends,
- Broad-based macro risks, including the inflation/rates axis, and geopolitical risks.
Nevertheless, UPBD is well positioned to compound intrinsic value into the coming periods and I estimate it could sell at $55 if valued fairly. Net-net, rate buy.
Read the full article here

