Being a student of market trends and cycles, I always like to observe how different sectors behave relative to the market index, to see whether the market’s ‘internal story’ remains consistent.
For the past 2 years, equity markets have been led by the ‘Magnificent 7’ stocks (namely Apple, Amazon, Alphabet, Meta, Microsoft, NVIDIA, and Tesla), and more recently, the ‘Magnificient One’ (NVIDIA), as investors seemingly could not get enough of the GPU manufacturer’s shares despite their elevated valuations.
However, lately, despite the Magnificient 7 still dominating the investment headlines, many of these ‘generals’ have begun to falter and market strength is being carried by other sectors.
For example, when we analyze the price action of the Vanguard Information Technology ETF (NYSEARCA:VGT), a technology sector ETF that is dominated by Apple (AAPL), NVIDIA (NVDA), and Microsoft (MSFT), we see that since an August market wobble, the S&P 500 Index has recovered to within a hair’s breadth from all-time-highs (“ATH”) but the VGT ETF is still a good 6.5% below its ATH (Figure 1).
Figure 1 – VGT is diverging from S&P 500 Index (Author created using stockcharts.com)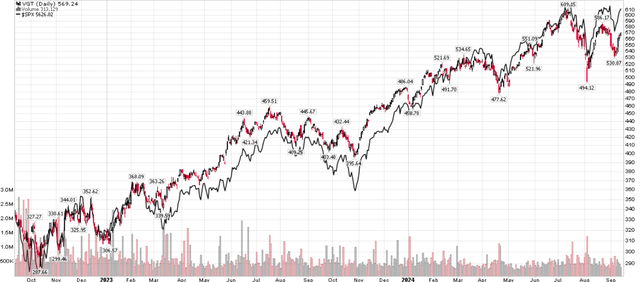
In the past 2 years, the S&P 500 Index and the VGT have traded virtually in lockstep, as the market indices were powered higher by surging technology shares, so this latest bout of divergence is noteworthy.
In my opinion, the ‘market internals’ is showing sector rotation happening, as investors take money out of ‘expensive’ technology shares and redeploy into ‘cheaper’ sectors. Furthermore, with an economic slowdown gathering pace, investors may be repositioning their portfolios for a possible recession.
I recommend investors heed the warnings from VGT’s relative weakness and take the opportunity to lock-in profits / raise cash. I rate the VGT ETF a hold.
Fund Overview
The Vanguard Information Technology ETF is an ultra-low-cost ETF that tracks the performance of information technology stocks. For an expense ratio of only 0.10%, the VGT ETF exposes investors to a portfolio of 318 of the leading U.S. technology stocks with a median market capitalization of $747 billion (Figure 2). The VGT ETF has over $87 billion in AUM and is one of the largest funds tracking the technology sector.
Figure 2 – VGT portfolio overview (vanguard.com)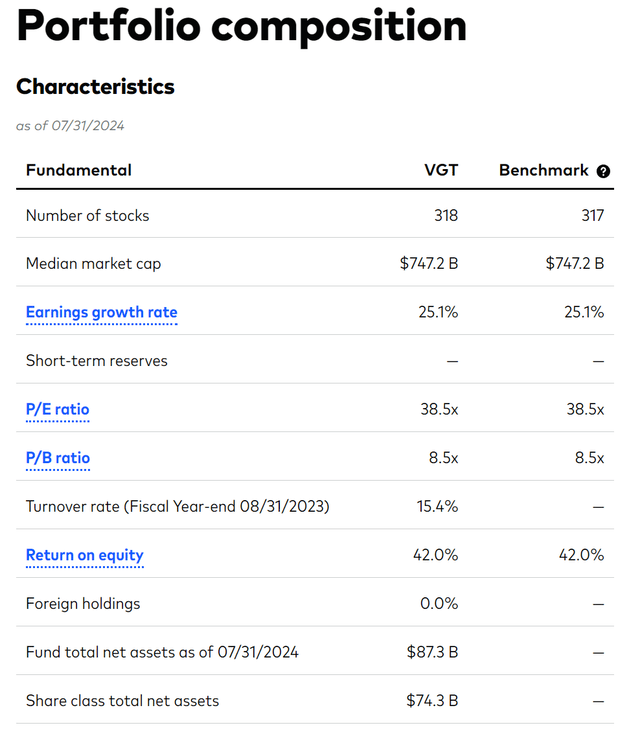
The VGT ETF is very top-heavy, with the top 10 holdings accounting for 61% of the fund (Figure 3).
Figure 3 – VGT top 10 holdings (vanguard.com)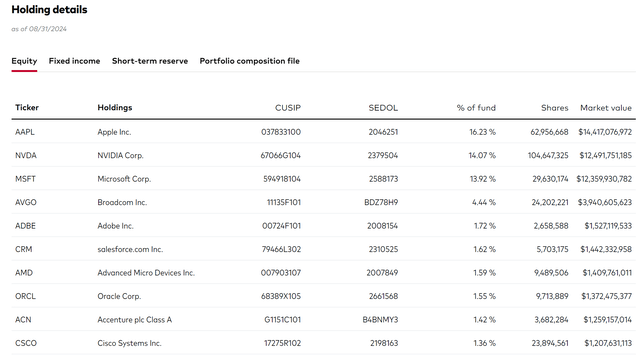
In fact, its top 3 holdings, Apple (AAPL) at 16.2%, NVIDIA (NVDA) at 14.1%, and Microsoft (MSFT) at 13.9%), account for an incredible 44% of the VGT ETF. An investment in the VGT ETF is basically a bet on the continued market dominance of Apple, NVIDIA, and Microsoft.
Stellar Historical Performance Riding Technology’s Coattails
Fortunately, technology stocks, especially the Apple-NVIDIA-Microsoft triumvirate, have been the place to be, allowing the VGT to deliver exceptional historical performance to investors. On a trailing basis to August 31, 2024, the VGT ETF has delivered 5/10/15-year average annual returns of 22.9%/20.3%/19.3% respectively (Figure 4).
Figure 4 – VGT has delivered exceptional historical returns (morningstar.com)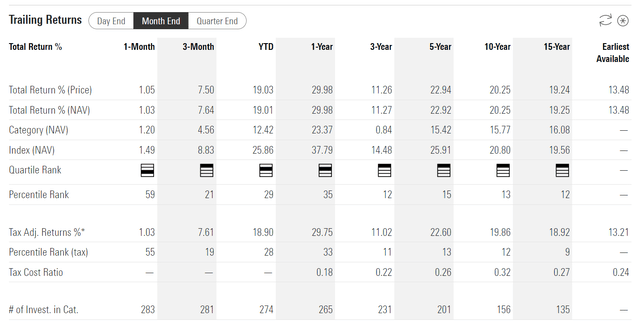
The only weakness in VGT’s track record has been 2022, when the fund lost 29.7% (Figure 5). However, VGT more than made up for it in 2023 when the fund returned an incredible 52.7%.
Figure 5 – VGT annual returns (morningstar.com)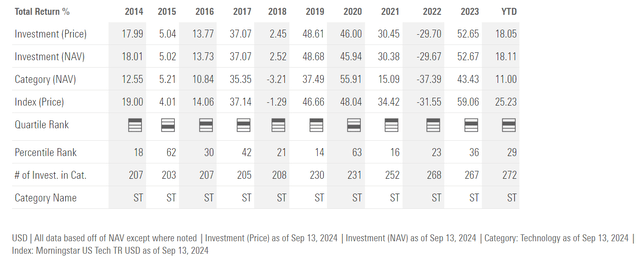
Sector Rotation…
While VGT’s historical returns have been incredible, I am cautious about the VGT ETF’s future returns, given the lofty valuations of technology stocks and where we are in the economic cycle.
As mentioned at the beginning of the article, the S&P 500 Index is currently trading near ATH while the VGT ETF is still a good 6-7% below its ATH, as other market sectors have taken leadership away from the technology giants.
In recent months, markets have been led higher by Utilities, as represented by the Vanguard Utility ETF (VPU), REITs, as represented by the Vanguard REIT ETF (VNQ), and Consumer Staples, as represented by the Vanguard Consumer Staples ETF (VDC) (Figure 6). In contrast, the VGT ETF has lagged behind the total return of the S&P 500 Index.
Figure 6 – VPU and VNQ have been leading markets in recent months (Seeking Alpha)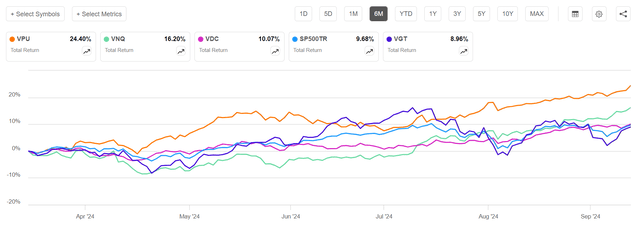
…Driven By Lofty Valuations…
In my opinion, one of the primary reasons for sector rotation is stock valuations. Consider Figure 2 above, which shows VGT’s portfolio trades at an average P/E ratio of 38.5x. This is almost 60% higher than the valuation multiple of the S&P 500 Index, which trades at 23.8x trailing P/E.
In contrast, Utilities were trading at a more reasonable ~16x Fwd P/E earlier in the year, so it made sense for value-oriented investors to rotate out of expensive technology stocks and into relatively cheaper utilities and other sectors (Figure 7).
Figure 7 – Utilities Fwd P/E (yardeni.com)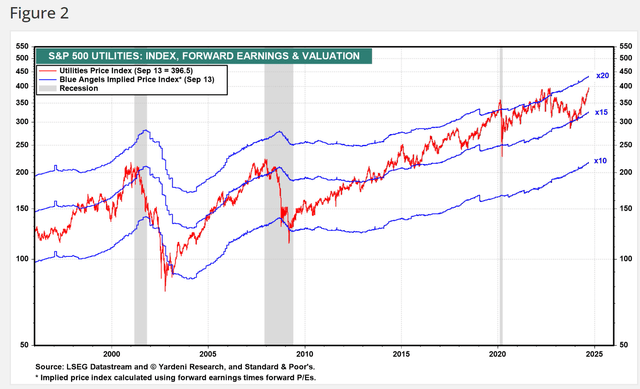
…And Economic Cycle Positioning
More importantly, with the economy finally showing signs of slowing, with the unemployment rate now 0.8% higher than cycle lows and the Fed about to embark on a rate-cutting cycle, I believe institutional investors are preparing their portfolios for a possible downturn in the economy (Figure 8).
Figure 8 – Unemployment rate accelerating higher (St. Louis Fed)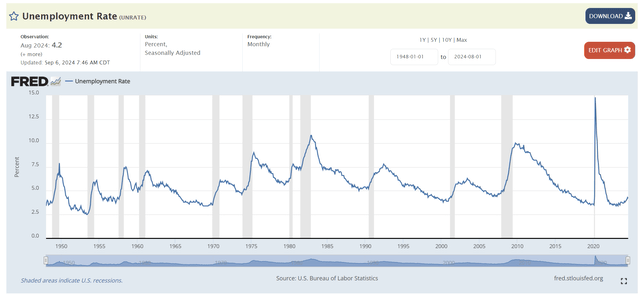
According to the well-established ‘business cycle’ investing concept that different sectors/stocks are favored at various points in the economic cycle, what we are witnessing right now in the marketplace, with Utilities and Consumer Staples outperforming and Information Technology lagging, is consistent with either Late cycle or early Recession (Figure 9).
Figure 9 – Illustrative business cycle investing concepts (fidelity.com)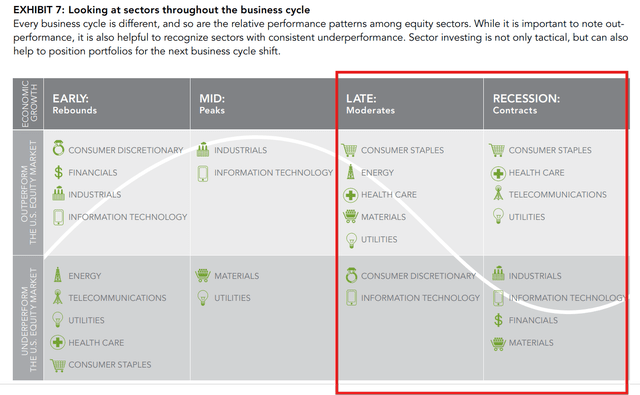
Essentially, what the market is telling us, if we are willing to listen, is that we may be nearing the end of the current economic cycle and that investors should position defensively in their portfolios (something that I have been recommending for months in other articles).
While I have painted a cautious picture above, I am not suggesting investors liquidate their holdings en masse. I am merely pointing out that the economy is slowing and downside risks are increasing, so it makes sense to take profits from the VGT ETF and either reallocate to a more diversified fund (i.e. not 44% held in only 3 stocks), or raise some cash to redeploy in more attractive areas of the market.
Upside Risks To VGT
In fact, there are upside risks to the VGT ETF that should be mentioned. As many investors are well aware, the Federal Reserve is widely expected to begin cutting interest rates at the upcoming September FOMC meeting in order to protect the U.S. economy from weakening. Market participants expect the Fed to cut 125 bps before the end of the year, and 225 bps within 12 months (Figure 10).
Figure 10 – Market participants are pricing in an aggressive rate cutting cycle (CME)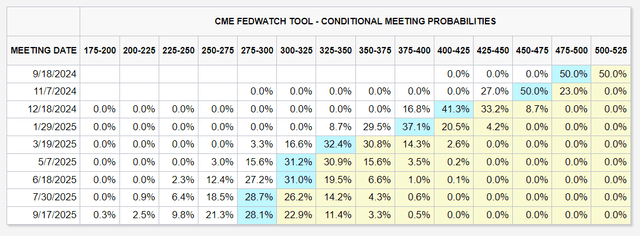
With that much stimulus expected over the coming year, economic growth could accelerate and we may find ourselves looking at a ‘soft landing’ scenario where the economy ‘skips’ over a recession and moves onto a new Early cycle positioning in a few months.
If that were to occur, then we should see the technology-heavy VGT ETF outperform the markets again (refer to Figure 9 above). However, in the short-term, I believe the VGT ETF is due for a pullback/consolidation, both to work off its valuation excesses, and for the Fed’s ‘medicine’ to take effect.
Conclusion
In summary, I believe VGT’s recent relative weakness compared to the S&P 500 Index is consistent with the economy entering a slowdown phase, and caution is warranted. In a recession scenario, I expect the VGT ETF may see significant downside, similar to the performance in 2022, because its portfolio trades at a lofty 38.5x P/E. I rate VGT a hold.
Read the full article here


