
Thesis
Readers familiar with our approaches know that we like to start with the big picture. And the big picture for this article is the chart below. It is our market sector dashboard (BTW, feel free to download via this link: Market Sector Dashboard). Here I will directly get to the point. For readers not familiar with the dashboard and its terminology, the next section provides a brief tutorial. Two overall impressions jumped out at us.
First, as the 10-year treasury rates push past 4%, all equity sectors are expensive in comparison to the risk-free rates, as indicated by the negative yield spread Z-score for all sectors. Tech and cyclically are the most expensive sectors in this regard. And traditional “safe sectors” such as utilities and stables are actually exposed to high levels of valuations risks in our view.
Author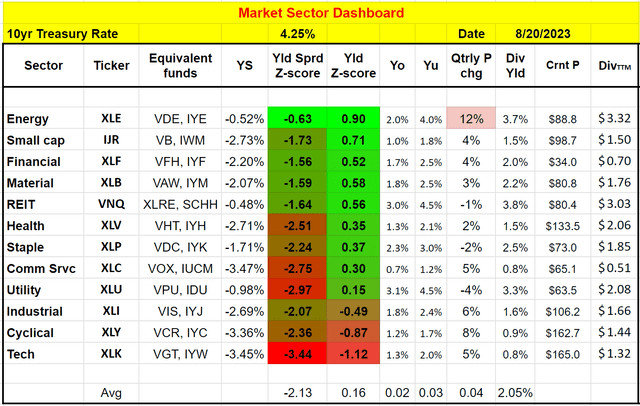
Second, the REIT sector, represented by the Vanguard Real Estate ETF (NYSEARCA:VNQ) is relatively attractive in comparison to other sectors. Its YS Z-score is admittedly negative like all other sectors, but it’s one of the least negative sectors. And in terms of its yield Z-score, it offers one of the highest scores among all the sectors.
A closer look reveals that its valuation is not only attractive when compared to other sectors, but it is also attractive compared to its own historical track record and other REIT funds as shown in the next chart. As seen, VNQ’s current TTM yield is reported at 4.7%, about 32% higher than its 4-year average of 3.54%, implying a large valuation discount. In comparison, SCHH, another popular REIT fund, offers a TTM yield that is about 25% above its 4-year average.
Seeking Alpha Data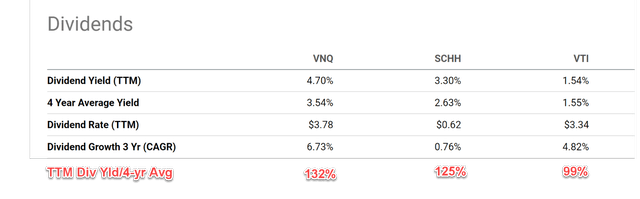
Note that in the TTM yield reported above, VNQ’s return on capital was included and considered part of the dividends. Its TTM dividend should be $3.08 according to our calculation (not $3.78 as commonly quoted on most websites) because about $0.7 of the distributions in the past 12 months were a return of capital. The inclusion of return of capital in the calculation of dividend yield could distort valuations.
And next, we will show that when the dividend yield is properly calculated, VQN remains attractively valued, probably more so.
The dashboard explained
As promised earlier, here is a brief recap of the terminologies and mechanics of our dashboard. If you’ve already seen these before, definitely skip this section.
- The yield spread Z-score. It gauges the dividend yield of a given sector relative to the 10-year treasury rates. How the yield spread is calculated will be detailed in the next section. A larger Z-score suggests a larger undervaluation compared to the historical record and treasury rates. And vice versa.
- A Z-score that is closer to 1 means the yield spread is near the thickest level of the historical spectrum and is color-coded by bright green. And vice versa.
- The yield spread Z-score. Similar to the yield spread Z-score, it gauges the dividend yield of a given sector relative to its own historical record. A larger Z-score (greener) suggests a larger undervaluation compared to its own historical record. And vice versa.
Closer look at yield and valuation
For REIT funds such as VNQ (or SCHH too), their dividends provide a good measure of their true economic earnings because they consistently pay out dividends and also, they are required to pay out most of their income as dividends. As a result, many REIT investors (this author included) rely on dividend yield as a more effective and accurate valuation metric compared to other metrics such as P/E and P/FFO. In the meantime, we firmly believe that all valuation metrics (whether it is dividend yield or P/E) should be interpreted in the context of risk-free rates. A good way to capture these insights involves the yield spread (“YS”) used above.
In the results presented above, we relied on the dividend yield between VNQ relative to the risk-free rates to evaluate its valuation. In this section, we will take two steps further in this direction. First, we will exclude the return of capital from the distributions, so that the yield truly and only includes dividend income. And secondly, we will calculate the yield spread between VNQ and the overall equity market (represented by VTI) to further evaluate its valuation. As detailed in our earlier article, the YS concept is not limited to a benchmark against risk-free rates and can be extended to other comparisons because:
- It’s a timeless intuition – no matter how times change, the risk-free rate serves as the gravity on all asset valuations. And consequently, the YS ALWAYS provides a measurement of the risk premium investors are paying relative to risk-free rates. A large spread provides a higher margin of safety and vice versa.
- Similarly, the YS against another benchmark (say, the overall equity market) shows the valuation compared to that benchmark.
With this background, the next chart below shows the YS between VNQ and VTI in the past 10 years. As seen, the current VTI-VNQ yield spread hovers around -2.29%, near its historical bottom as indicated by the yellow bow. Again, in this chart, we’ve systematically excluded VNQ’s return of capital from its dividends.
We felt that the quotation of a specific target price only shows the “fish”. And this is the chart that shows our “fishing method” when it comes to REITs. To wit, in our view, a VTI-VNQ yield spread near or below -2.0% (the lower bound of the yellow box) would indicate an extremely attractive VNQ valuation compared to the overall equity market. And the current YS is at (actually a bit lower than) this level already. That is why we are starting to gradually replace some portion of our equity holdings with REIT.
Author Based on Vanguard Data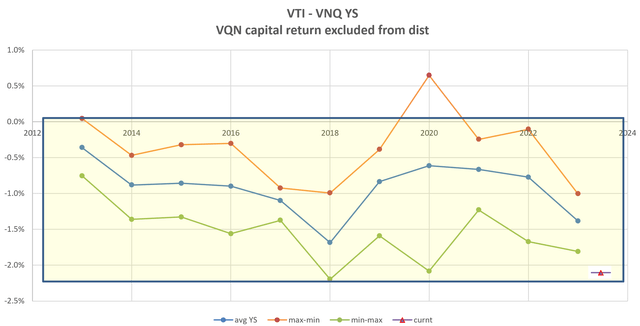
Risks and final thoughts
As an index fund, VNQ is exposed to essentially the same macroeconomic risks facing other index funds. And these risks include the possibility of a recession, geopolitics risks, and the risks of future interest rate increases. As such, here I want to focus on a few more specific issues. First, VNQ charges a higher fee of 0.12%. It is substantially above overall market index funds such as VTI (whose fee is only 0.03%) and also competition REIT funds (e.g., SCHH charges only 0.07%). Secondly, VNQ also has a higher turnover rate (7% as of this writing) compared to SCHH (6%) and VTI (only about 3%). Such higher turnover could cause tax headwinds in non-sheltered accounts.
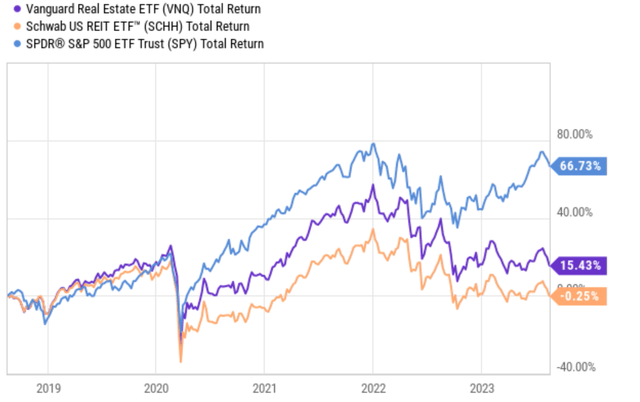
All told, our conclusion is that the REIT sector is a more attractively valued sector amid an otherwise expensive market. And within the REIT sectors, we particularly like VNQ. Admittedly, it has its issues as mentioned above. However, we felt these issues are relatively minor compared to its strengths – broad representation and large valuation discount. And if you recall from the 2nd chart in this article, the fund also features higher dividend growth rates (6.73% CAGR in the past 3 years) than both its REIT peer SCHH (0.76% CAGR) and also VTI (4.82% CAGR). For these reasons, the fund has outperformed SCHH by a good margin in the past (see the second chart below) and I see good odds for the outperformance to continue.
Seeking Alpha Data Seeking Alpha Data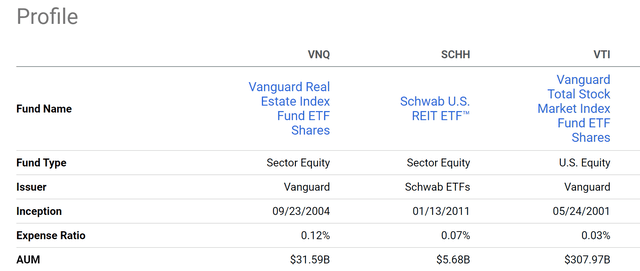
Read the full article here

