
Investment Thesis
This article aims to determine if the Vanguard Mid-Cap Value Index Fund ETF Shares (NYSEARCA:VOE) is a suitable investment for value investors targeting the $20-$30 billion market cap segment. To do so, I evaluated its performance and fundamentals against two alternatives plus its large-cap value counterpart, as follows:
- iShares Morningstar Mid-Cap Value ETF (IMCV).
- iShares Russell Mid-Cap Value ETF (IWS).
- Vanguard Value Index Fund ETF Shares (VTV).
My main findings were that VOE has a better five- and ten-year track record than IMCV and IWS but is behind VTV by about 31% on ten-year returns. Risk-adjusted returns followed a similar pattern, but VOE’s growth and free cash flow margins are serious issues. Although these factors are not typically emphasized with value ETFs, they’re crucial to a well-balanced ETF, and VOE’s relative rankings on these factors warrant some caution. Therefore, I don’t recommend VOE at this time, but I will suggest a higher-quality alternative at the end that I hope you will consider.
VOE Overview
Strategy Discussion
VOE tracks the CRSP US Mid Cap Value Index, selecting securities based on five factors:
- Book to price.
- Forward earnings to price.
- Historical earnings to price.
- Dividends to price.
- Sales to price
In a previous review, I noted my preference for this mix of forward- and backward-looking metrics. This approach acknowledges a company’s past results but gives some weight to changing market conditions. One unique feature of CRSP Indexes is that there is some overlap, meaning it’s not a pure mid-cap value fund. Approximately 20% of VOE’s holdings by weight are in the large-cap Vanguard Value Index Fund ETF Shares (VTV).
Fund Basics
The following table highlights some statistics for VOE and the three alternatives. As shown, VOE’s 0.07% expense ratio is competitive, and it’s the largest of the three mid-cap value funds with $14.99 billion in assets under management. It also offers a 2.52% dividend yield paid quarterly, though dividend growth consistency could be better. VOE’s dividends were lower in 2021 vs. 2020, while VTV is on a 12-year growth streak.
The Sunday Investor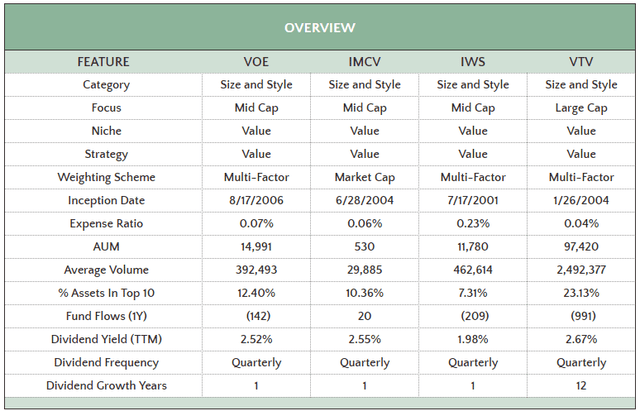
Sector Exposures and Top Ten Holdings
VOE’s sector exposures are below, alongside IMCV, IWS, and VTV. We can compare VOE and IMCV to see the difference between the multi-factor and market-cap-weighting schemes, and the first takeaway I have is that Technology stocks appear overvalued. VOE has only 5.69% allocated to this sector, while Financials is its largest exposure area at 19.63%.
Morningstar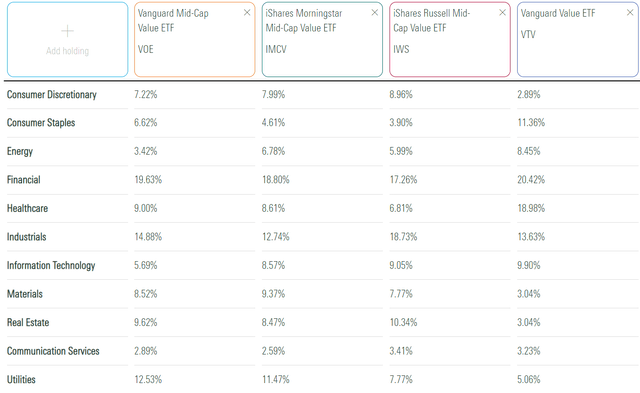
There’s also a healthy allocation to Utilities stocks at 12.53%, one of the worst-performing sectors this year across all size segments. Surprisingly, this exposure improves VOE’s meager growth rate, as estimated earnings growth is about 5.5% vs. 2.23% for the overall portfolio.
One of VOE’s greatest strengths is its strong diversification. However, it’s also a feature in most mid-cap value ETFs, including IMCV and IWS. Even VTV has a sector exposure range between 3-20%, and its largest holding is Berkshire Hathaway Inc. (BRK.B) at just 3.81%. Diversification may play an important role when deciding between growth ETFs, but it’s less of a concern here.
VOE’s top ten holdings, totaling 12.40%, are listed below. Arthur J. Gallagher & Co. (AJG) represents what totals 8.99% of insurance-industry exposure, followed by Carrier Global Corporation (CARR) and PACCAR Inc (PCAR), representing the Building Products and Construction Machinery & Heavy Transportation Equipment sub-industries. Finally, there’s also Digital Realty Trust, Inc. (DLR), one of 19 REITs in VOE’s portfolio totaling 9.07% in weight, indicating that not all income is designated as qualified dividend income.
Vanguard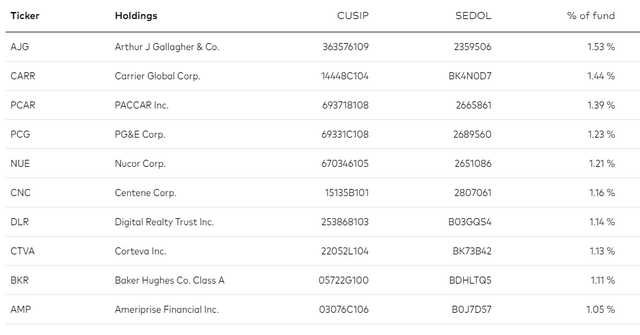
Performance Analysis
Over the last decade, mid-cap value stocks have generally lagged behind their growth counterparts. Consider these 1-10Y total returns for 34 mid-cap ETFs with at least a ten-year history. Remember that the indexes tracked by some of these funds have changed recently, but I only want to illustrate quickly the performance difference between the two styles.
The Sunday Investor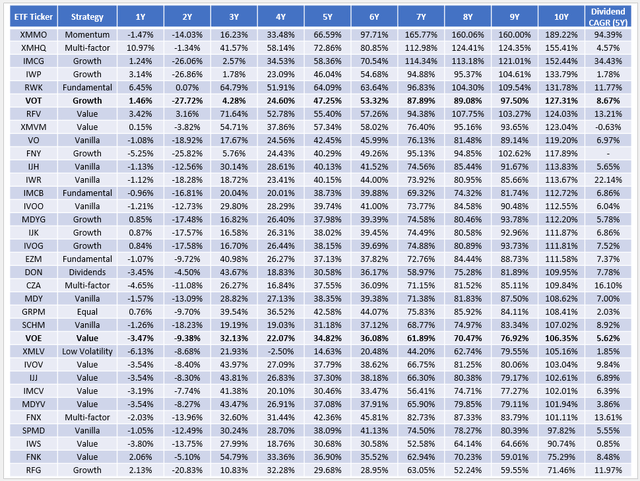
I’ve bolded the returns for VOE and the Vanguard Mid-Cap Growth Index Fund ETF Shares (VOT), highlighting a 21% ten-year performance gap. Still, as you scan through the periodic returns, you’ll see how many value ETFs outperformed over the last few years. This reflects how the popularity of growth stocks is only linked to the performance of the Magnificent Seven, as VOT has managed just a 4.28% total return in the three years between November 2020 and October 2023. If you’re concerned about that concentration or feel these seven stocks are overvalued, allocating a portion of your portfolio to an ETF that, by design, avoids these stocks is good risk management.
Also, I want to point out that the 94.39% five-year dividend growth rate provided for the Invesco S&P MidCap Momentum ETF (XMMO) looks off. I calculated a still-impressive 44.76% figure, but I will confirm with the data team, as I want everyone to make investment decisions based on accurate information. The 34.43% figure provided for the iShares Morningstar Mid-Cap Growth ETF (IMCG) is accurate and may interest younger growth investors looking for a decent income in retirement.
As for VOE, it’s held up reasonably well against IMCV and IWS and has even outperformed VTV since September 2006. One differentiator with mid-cap value stocks is higher volatility, evidenced by VOE’s 18.20% annualized standard deviation vs. 15.68% for VTV.
Portfolio Visualizer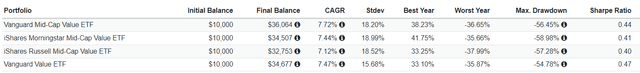
This higher volatility also shows up when analyzing rolling returns. However, volatility can be a positive feature. VOE’s best five-year annualized rolling return was 28.05% between March 2009 and February 2014, while VTV’s best was 22.63% during the same period.
Portfolio Visualizer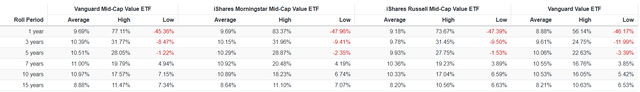
From this perspective, VOE is most attractive on market weakness. While it’s challenging to call a bottom, VOE’s current 6.30% annualized five-year return is on the low end, ranking #117 over the 148 monthly periods available. IMCV, IWS, and VTV rank #118, #117, and #115, so I think considering value ETFs again is a good idea.
VOE Fundamental Analysis
The following table highlights selected fundamental metrics for VOE’s top 25 sub-industries, totaling 62.90% of the portfolio. I’ve already discussed how mid-caps are typically more volatile than large-caps, but VOE’s 1.03 five-year beta is surprisingly low. One key reason is that nearly 11% is allocated to low-beta utilities.
The Sunday Investor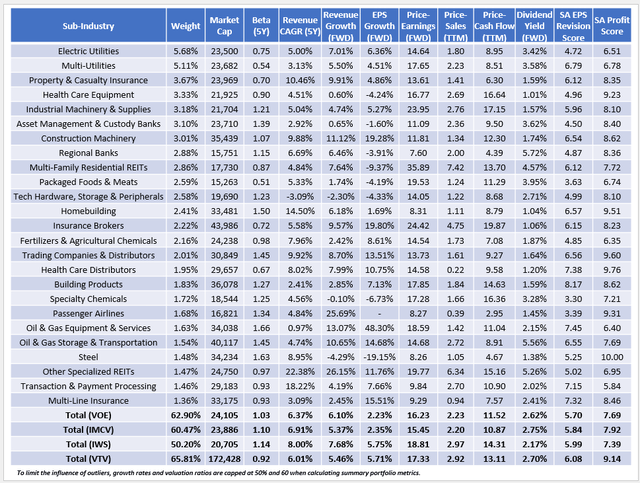
My primary concern is VOE’s 2.23% estimated earnings per share growth rate, and, as I mentioned earlier, Utilities are surprisingly not the problem. It’s Health Care Equipment, Regional Banks, and even some Technology stocks whose expectations are low. 78/194 holdings, or 35.54% of VOE’s portfolio by weight, have negative estimated earnings growth rates, compared to 28.33% for VTV. Furthermore, VOE’s weighted average trailing EPS growth rate is -2.77%, while IWS and VTV are positive at 2.27% and 1.57%. These figures are highlighted in the growth summary table below.
The Sunday Investor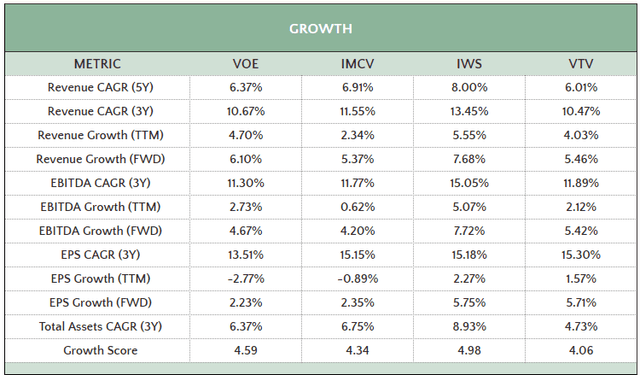
In fairness, VOE’s estimated and historical sales growth figures are superior to VTV’s, which likely factors into its higher Seeking Alpha Growth Score of 4.59/10 vs. 4.06/10. However, I believe estimated earnings growth matters more, and VOE ranks a disastrous #56/58 mid-cap ETFs in my database.
On valuation, VOE trades at 16.23x forward earnings, slightly more than IMCV but 1.10 points less than VTV. Importantly, all holdings have positive trailing twelve-month net margins, a characteristic not featured in most small-cap funds, and VOE’s overall 7.69/10 profit score ranks #14/58 among mid-cap ETFs. It’s not nearly as high at VTV’s 9.14/10 score, but lower profits are the expectation for smaller companies, so I don’t hold it against VOE. Here are some other profitability and quality-related statistics to consider:
The Sunday Investor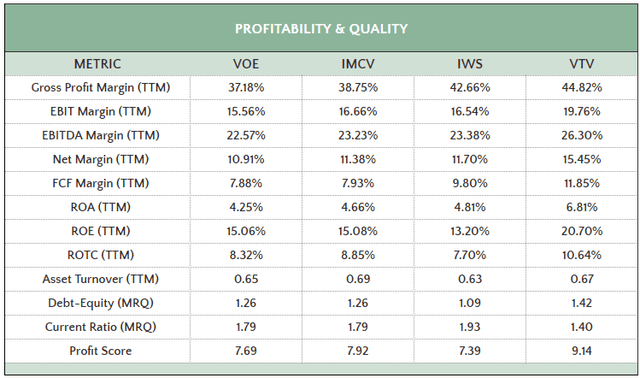
One cautionary note is VOE’s relatively low 7.88% weighted average free cash flow margins, about 4% less than VTV offers and #48/58 among all mid-cap ETFs. Naturally, companies with high free cash flow can pay dividends, expand, and pay down debt. Inflation and interest rates have lasted longer than I expected, so incorporating free cash flow into your analysis is prudent, given the uncertainty. Pacer Cash Cow ETFs do this, but I recommend the Invesco S&P MidCap Quality ETF (XMHQ). Its free cash flow margins are tenth-best among mid-caps, its debt-equity ratio is the lowest, and it has an excellent track record. Since it began tracking its current Index in June 2019, XMHQ has easily outperformed Vanguard’s CRSP mid-cap ETFs.
Portfolio Visualizer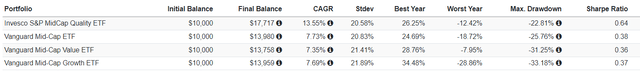
Investment Recommendation
VOE offers mid-cap value investors many positive features, including lower-than-average volatility, adequate quality, and a low 0.07% expense ratio. My concerns are with its weak 2.23% estimated earnings per share growth rate and 7.88% free cash flow margins, which might prove insufficient if interest rates stay higher for longer. I believe it’s better than IWS due to its cheaper valuation, similar to IMCV, but inferior to VTV based on its profitability and growth characteristics. Therefore, I’ve rated VOE a “hold,” and I look forward to discussing this further in the comments section below.
Read the full article here

