“Common Sense is something everyone needs, few have, and none think they lack.” …. Benjamin Franklin
Virtually every economist on the planet who’s following the data expects the U.S. economy to slip into recession later this year or early in 2024 because, surely, real interest rates have risen high enough and the yield curve is sufficiently inverted that such an outcome is almost guaranteed. There is a contingent who has thrown in the towel and has decided the economy has a lot more momentum than is generally believed at the moment. They have built a case on the fact that economists’ expectations for the timing of the recession have steadily been pushed farther and farther into the future. Initially, first-quarter GDP growth was expected to be about unchanged. It ended up at 1.3%. Second-quarter growth was initially expected to be about 1.0%. We do not yet know what happened to GDP growth in the second quarter but the consensus appears to be about 2.0%.
More importantly, they do have the stock market which is also telling a different story on their side as well. It has put together an impressive rally and it is now within 8% of its pre-recession, pre-pandemic record high level. The stock market is certainly not anticipating a recession any time soon. This steady run-up in stock prices can start to accomplish several things. It will boost consumer confidence off historic lows and presumably will benefit consumer spending. That may also translate to business confidence and give business leaders both the willingness and the ability to quicken investment spending.
If all of that happens the economy will stay a lot more resilient than the Fed’s forecast of 1% GDP growth this year and 1.1% GDP growth in ’24. So while that is a positive the flip side is a distinct negative. It will be substantially more difficult to reduce the core rate of inflation. If that scenario unfolds the Fed will have a lot more work to do than the two additional rate hikes it envisions between now and yearend. Many of the same economists that are using out the recession are the same that now expect the Fed to raise the funds rate to 6.0% by September which would boost the real rate to 1.4%.
Presumably, a real funds rate of that magnitude should produce a recession in the first half of 2024. The unfortunate reality is that we are all guessing about how high the real funds rate needs to be to slow the pace of economic activity enough that the core inflation rate will begin to shrink more quickly. Thus far, the economy has refused to cooperate and inflation remains sticky.
One of the reasons for this widespread expectation of a recession stems from the index of leading indicators which has been falling steadily since December 2021. It has been signaling recession for a year and one-half. This index is the compilation of a dozen indicators each of which are leading indicators. One of those components is the S&P 500 index.
LEI (www.conference-board.org)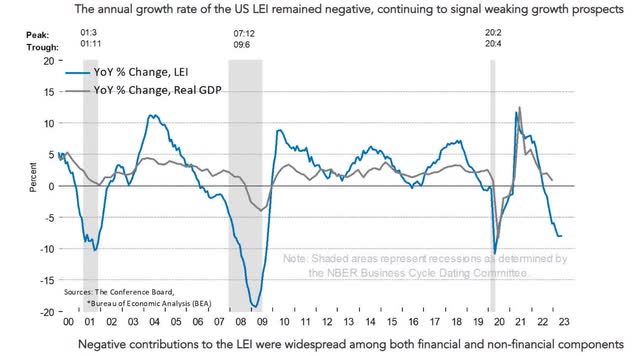
It is now declined for 14 consecutive months, the worst since the 24 straight drops from April 2007 to March 2009, but the stock market continues to climb. As June rolls on, it starts to feel more and more like 1999, as nearly every equity index in the world is suddenly well above its 50/200 Day moving averages at the end of a rate hiking cycle (yes, Fed was raising throughout 1999/early 2000). Week after week it shrugs off the fear of recession, worries about the impact of previous increases in interest rates, and tighter bank lending standards. Stock investors are not worried at all about a recession. Economists/Market Analysts are. Somebody has this wrong.
The general feeling is the post-pandemic stimulus swung the pendulum so far in one direction it completely distorted the economy and inflation rate picture. Leading up to the present there has never been a scene where so much money was unleashed on the economy. Therein lies THE reason why it has been so difficult to figure out exactly what is transpiring now. Nothing about this post-pandemic scene has behaved exactly as economists had envisioned.
Confusing or not, right or wrong, when it comes to investing, emotions, and “feelings” have to take a back seat to price action. This conflicting situation, and in fact, the entire investment scene that has popped up this year got me thinking. No, not just casual thoughts, but REAL thinking and consulting with other trusted colleagues.
Where have we seen this before?
That brought me to an interesting set of facts. If we go back to the 1990s and the immediate period leading up to the market highs in 2000, we uncover an interesting picture when it comes to interest rates and the relationship to stocks.
The Fed Funds Rate,
Fed Funds (www.macrotrends.net/2015/fed-funds-rate-historical-chart)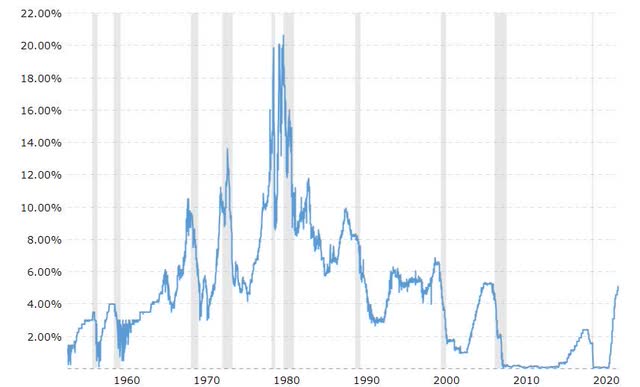
Real Interest Rates,
REAL Rates (www.fred.stlouisfed.org/series/REAINTRATREARAT10Y)
and the 10-year Treasury,
10YR Treasury (www.macrotrends.net/2016/10-year-treasury-bond-rate-yield-chart)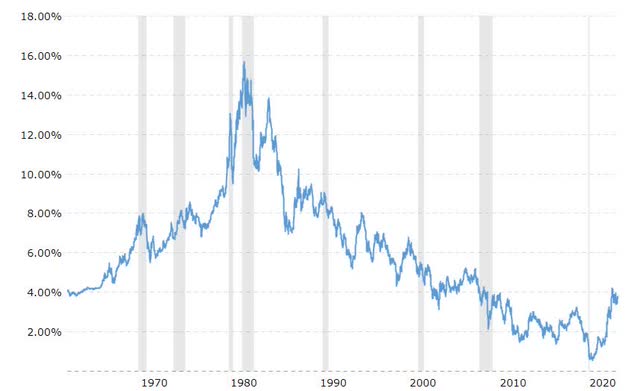
were all higher than they are today. The links provided for the three charts are interactive and if you follow those links the charts will provide the details for the period in question. So, when we zoom in, we see that similar to today, the Fed Funds rate was on the rise, going from 4.68% in January 1999 to 6.51% by July 2000. Real rates were 2.30% in January 1999 rising to the March 2000 peak at 3.44%. The 10-year Treasury traded at 4.66% in January 1999, before it rose to a cycle peak of 6.79% in January 2000.
During that same time frame, the S&P rallied 23%, the DJIA 25%, and the NASDAQ rose 114% which ended with the dot.com bust. I’m not suggesting the Tech rally will get to those levels, nor am I predicting a big market crash. However, this history lesson, comparing Interest Rates, and Stocks tells us despite what seems to be a confusing investment picture we’ve seen this act before.
Let’s face it, because of the low-interest rate environment we have experienced for the last 10 years, we’ve been conditioned to believe high-interest rates kill the technology sector. Furthermore, a higher 10-year will dissuade investors from investing in stocks, and run to the safer yield. The period we just examined destroys those notions and tells us, the interest rates we are discussing now are NOT the huge drag that is been burned into our recent memories.
So where does all of this leave us? Well for one, it provides a better understanding of what is transpiring and to an extent justifies the robust rally we have witnessed, especially in technology. It also explains why the stock market shelved its obsession with the Fed and Interest rates a while ago. Perhaps it’s also time to stop listening to all of the rhetoric surrounding what the Fed will or won’t do, or how close we are to the end of the cycle, etc.
Strategy
Regardless of this new “evidence”, the MACRO view stays the same. We have witnessed a “change” in price action and that prompted a change in approach. Rather than looking for the next shoe to drop at any moment, the recent market strength will keep the indices more resilient. In the interim I expect buyers to come back in and support stocks when there are pullbacks.
Our basic approach that tracks both short and long-term support levels continues. With the S&P 500, NASDAQ, and NASDAQ 100 all above their LONG TERM moving average trend lines, it brings more confidence and added conviction to the table. That is a notable change from what we have been accustomed to during the throes of the BEAR market trend.
Naturally, we don’t want to see a replay of the dot.com bust during 2000. While euphoria has gripped portions of the technology scene, to date, I don’t see similarities to that era. Back then it was a list of companies with no earnings dominating the high volume, new highs list every day. Today it is a host of solid large cap ten giants that dominate that picture. While they can be seen as overvalued they are indeed REAL companies, with REAL earnings.
So for now, there isn’t a need to debate whether this is a NEW BULL market, a continuation of the OLD BULL market, or simply the same BEAR Market that will eventually get re-energized. Therefore, with so much conflicting data, I also don’t see a need to get deeply entrenched in a BULL or BEAR mindset now. Doing so may limit our playing field, thus limiting opportunity.
While it sure feels “different”, in essence, we will proceed as always. Trade the scene that is in front of us.
The Week On Wall Street
Market participants embarked on the last week of what can only be considered a strong first half for equities in a cautious mood. BULLS were looking to regroup on Monday after the first negative week in the last six. They failed to rally the troops as the S&P 500 lost ground (-0.45%) for the 5th time in the last 6 sessions. That being said, breadth was positive by better than 2:1 as the “selling” has been very orderly.
Turnaround Tuesday ushered in a rally that broke the 7-day losing streak for the DJIA and lifted all of the other indices as well. Tech is still in demand, as the NASDAQ immediately recouped Monday’s 1.1% decline with a 1.6% gain. The small caps (IWM) also staged a nice comeback offering another hint that the rally is broadening.
The BULLS paused on Wednesday but came back strong long Thursday and Friday to finish the month of June on a positive more. All of the major indices posted gains for the week. The Russell small caps (IWM) led the way with a 4% gain.
The Economy
Q1 GDP was revised much higher coming in at 2.0% versus 1.4% expected. Personal Consumption was stronger than expected (4.2% vs 3.8%), and net exports saw a large revision higher.
U.S. personal income rose 0.4% in May and spending edged up 0.1%, with the latter disappointing. Income was up 0.3% in April and 0.4% in March, and has increased every month since February 2022. Spending jumped 0.6% in April after a 0.1% gain in March and has risen for five straight months.
Wages and salaries increased by 0.5% from 0.4%. Disposable income rose 0.4% versus 0.3%. The savings rate moved back up to a 4.6% pace from 4.3%.
The key PCE price indexes, the Fed’s favored indicator, was up 0.1% from 0.4% previously. And it’s at a 3.8% y/y rate, slowing from 4.3% y/y previously. And it is down from the 40-year peak of 7.0% y/y last June. It is the slowest since April 2021. The core metric rose 0.3% from 0.4% and is at a 4.6% y/y clip, a nudge lower than the prior 4.7%.
YES, there is an improvement in the inflation picture since the Fed entered the picture, BUT there remains a CORE that is going to take more time to drop it to the 2% target.
Manufacturing
Manufacturing remains a troubled area of the economy.
Dallas Fed manufacturing index edged up 5.9 points to -23.2 in June, erasing the -5.7 point decline to a three-year low of -29.1 in May. Nevertheless, this is the fourteenth straight month in contraction. Many of the components declined and/or remain in negative territory.
Dallas Fed (www.tradingeconomics.com )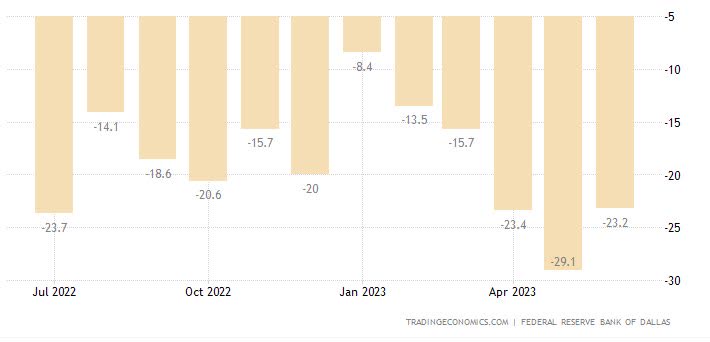
Richmond Fed’s manufacturing index rose 8 points to -7 in June after falling -5 ticks to -15 in May. It has been in negative territory every month this year.
Richmond Fed (www.richmondfed.org/)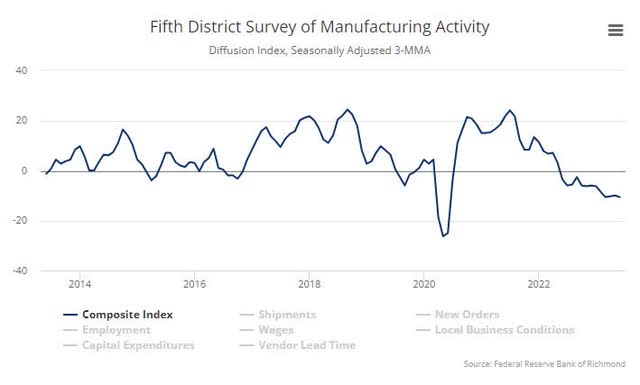
The U.S. consumer confidence index spiked to 109.7 in June after falling to 102.5 in May. This is now the highest since January 2022. Strength was in both components.
The Chicago Business Barometer, also known as the Chicago PMI, increased to 41.5 in June of 2023 from 40.4 points in May 2023, but well below market forecasts of 44.
Chicago PMI (www.tradingeconomics.com)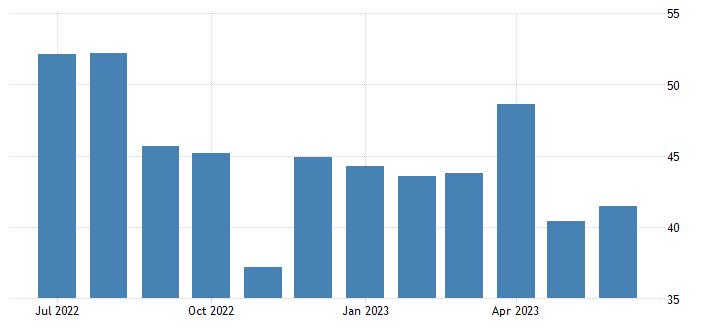
This reading marked the tenth consecutive month of contraction in business activity in the Chicago region.
The Durable Goods report sharply beat estimates with a 1.7% May orders gain with a solid 0.6% ex-transportation rise, alongside a 3.9% climb for transportation (airline) orders. The equipment data beat assumptions across the board, while overall shipments and inventories beat estimates as well. Robust May data followed small April revisions that were mostly upward.
Housing
Pending home sales dropped 2.7% to 76.5 in May, weaker than forecast, after slipping 0.4% to 78.6 in April. Today’s reading is approaching the record low of 71.8 from April 2020. And it is well below this year’s peak of 83.2 from February). The National Association of Realtors noted the lack of inventory continues to be a headwind.
New home sales beat estimates with a 12.2% May bounce to a 763k pace that marks a 15-month high. Analysts saw a 6-year low rate of 543k in July of 2022. The median price bounced 3.5% in May to $416,300 from a 22-month low of $402,400. Home inventories fell to 428k, leaving this gauge well below the 13-year high of 466k in October, while the months’ supply of homes fell to a 15-month low of 6.7 from a prior low of 7.6.
New home sales and median prices have proven remarkably resilient to headwinds from elevated mortgage rates that have disqualified many buyers. Sales are supported by the climb in new home completions from the housing starts report to a 16-year high in February, before a small ensuing pullback. Analysts expect new home supply to rise in 2023 as reduced material shortages allow a catch-up in deliveries.
Housing remains a very positive scene that adds more confidence keeping the soft-landing conversation alive.
Consumer
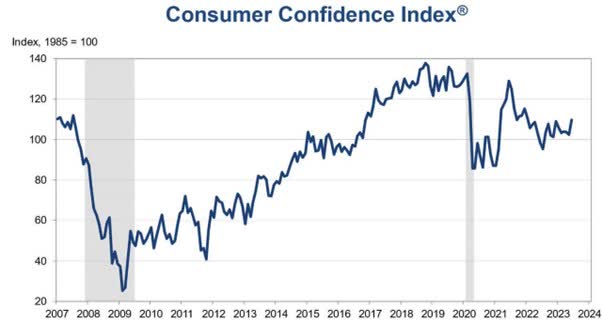
The rebound in confidence is a welcome sight.
The final June read on Michigan Consumer sentiment rolled in at 64.4.
Consumer Sentiment (www.sca.isr.umich.edu/charts.html)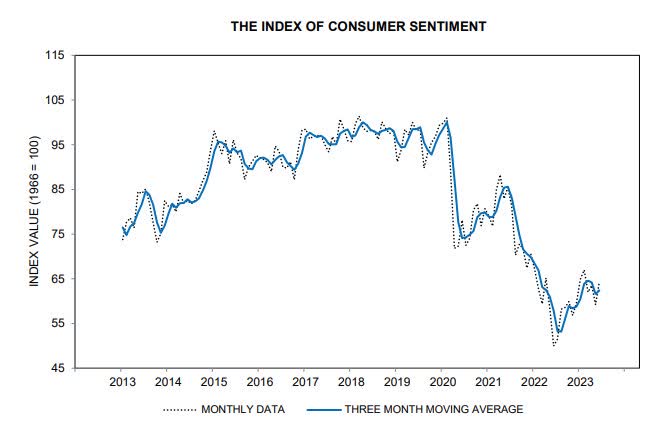
That represents an 8.8% increase over the May report.
However, it must be noted that these confidence levels are well off the pre-pandemic reports. Better 401k results and lower gas prices go a long way in improving the mood of consumers.
The Supreme Court voted 6-3 to toss out the Administration’s student loan relief program that would eliminate student debt. Once payments resume, the typical student-loan payment will be between $210 and $314 a month, according to a new report from Wells Fargo. More than 43 million people collectively owe $1.6 trillion in federal student-loan debt as of March 31st. While it will be a hit to those that are affected, it is 1.6 Trillion that won’t be borne by taxpayers and will assist the Fed in its efforts to curb inflation.
The Global Scene
The ECB Forum on Central Banking took place this week in Portugal. There is one message that continues to resonate with all of the central bankers/policymakers. The 2% inflation target remains the goal and it isn’t going to be changing anytime soon.
The EU joins the ‘higher for longer” scene. Similar to the US, inflation in the EU remains an issue prompting Christine Lagarde to say she doesn’t see an end to rate hikes “Anytime Soon”.
German IFO: The monthly survey of businesses from across economic sectors in Germany showed a huge drop against expectations for the Business Expectations series. That series is generally the best correlated with future economic activity as measured by GDP, so this latest leg lower is not a good sign for the backdrop in Europe’s largest economy.
German IFO (www.besopkepremium.com)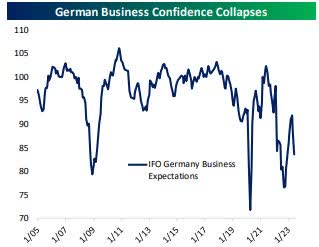
China
Weak economic data (see PMI charts below) helped spark a PBoC statement on monetary policy;
“China’s demand is still insufficient for growth and that the central bank will step up macroeconomic policy adjustment while reiterating a basically stable yuan and promising to firmly prevent risks of huge yuan fluctuations.”
CHINA PMI (www.bespokepremium.com)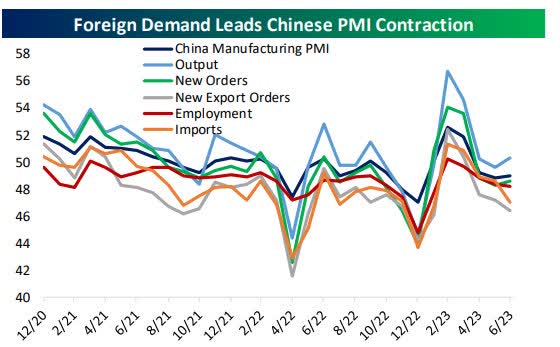
The official manufacturing purchasing managers’ index (PMI) inched up to 49.0 from 48.8 in May but remains below the 50-point mark that separates expansion from contraction and is in line with forecasts.
The “Services” sector activity for June also recorded its weakest reading since China abandoned its strict COVID curbs late last year, data from the National Bureau of Statistics showed.
CHINA Services (www.bespokepremium.com)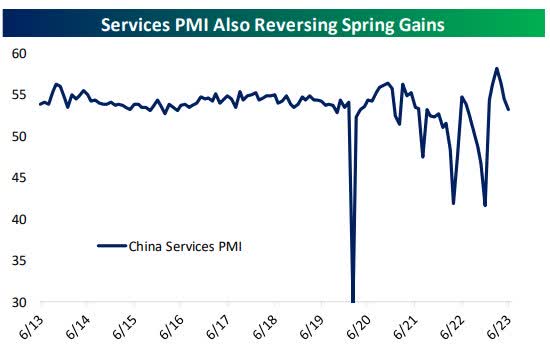
The non-manufacturing PMI fell to 53.2 from 54.50 in May, indicating a slowdown in service sector activity and construction.
Earnings/Valuation
Yardeni Research has been on point when it came to identifying the catalysts for the rally this year. In a recent report, they highlighted that it’s quite rare to see the S&P 500 trade at such a steep multiple compared to the S&P 600.
S&P forward PE (www.yardeni.com)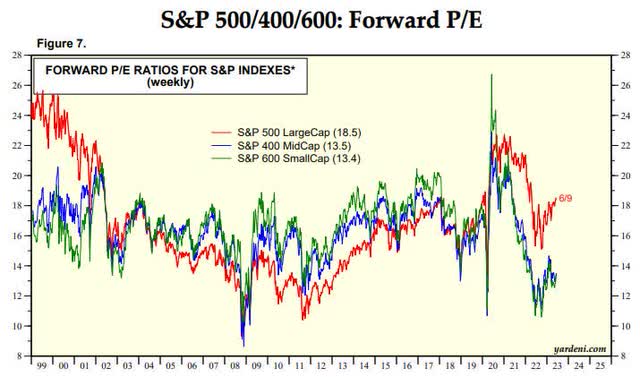
Something has to give. Either the drivers of the S&P 500 revert to the mean or the broad-based S&P 600 plays catch up. Of course, we can also see a little bit of both, but at some point, this divergence gets rectified.
The FED
From the outset, I have maintained that investors will have to deal with a higher for a longer backdrop when it comes to interest rates. The recent commentary from the Fed told markets that they want to preserve flexibility for future rate hikes if the economic data does not slow enough to cool inflation, but also to ensure that financial conditions remain appropriately tight. However, the longer the Fed maintains a restrictive policy stance, the more likely it is that economic growth and inflation will slow and the more challenging it will become for businesses to access the capital they need to grow and service their debt.
Herein lies a fine line. The earlier analysis highlighted the relationship between rates and their effect on stocks, and it demonstrates, that relatively speaking, the present rate backdrop is still not all that detrimental to the equity market. It is what happens in the ‘higher for longer” scenario that remains unknown.
Food For Thought
Back in January, it was reported that Blackrock lost about 4 Billion in their asset base due to pushback to their “ESG” campaigns. Larry Fink the once proud proponent of his ESG-branded funds now says he is ashamed to be part of the ESG controversy. While he won’t use the term “ESG” any longer, his funds continue to push an agenda he now calls “conscientious capitalism” that does not fulfill the firm’s moral duty to their clients. ESG is nothing more than a regulatory burden that cost corporations, their customer base, and eventually the investment community billions.
Every money manager’s primary focus is to maintain their FIDICUARY responsibilities FIRST. Putting social responsibilities ahead of that violates their mandate. Perhaps the $4 Billion lost and warnings from attorneys will dissuade other firms from entertaining a mindset that has no business in the corporate world of a capitalist society.
The “EV” Wreck
Anyone that has followed my analysis has come to realize that I have been BEARSIH on the EV “startups”. I’ve maintained an opinion that many, if not all of the new entrants into this space will face obstacles that will either see them eventually merge with others OR completely disappear. Lordstown Motors joins the unenviable parade of bankruptcies that have plagued the industry.
Even the more well-known better-capitalized EV startups, including Rivian Automotive and luxury carmaker Lucid Group, have seen their cash piles and share prices dwindle. Both Rivian and Lucid have failed to meet earlier production goals as they faced parts shortages and manufacturing problems. The issues don’t end there. Similar to the large automakers, there is a long runway ahead (perhaps the end of the decade), before a manufactured EV produces a profit for these companies.
One might suggest that the rush to go all EV be slowed down until production enhancements make them “affordable”, and can be sold at a profit. Rolling vehicles off assembly lines that destroy the bottom line for manufacturers to make an “agenda item” is insanity.
It would be difficult to make an argument that doing the latter will be good for the economy. If we add in the uncertainty that rushing to ALL EVs will do anything for the climate, while burdening an electric grid that is already stressed, then the impact becomes negative for economic growth.
The rhetoric that the auto industry will now produce job growth with higher-paying jobs isn’t aligned with what the industry is projecting through 2031. Those projections assume the adoption rate for EVs remains strong, despite all of the underlying EV issues that point to the opposite.
The Daily Chart of the S&P 500 (SPY)
After a quick test of the ascending trend line, the S&P 500 continued its march higher setting its sights on the recent closing high of 4425. With the strong rally on Friday and a close at 4450, it was mission accomplished.
S&P 500 (www.tc2000.com)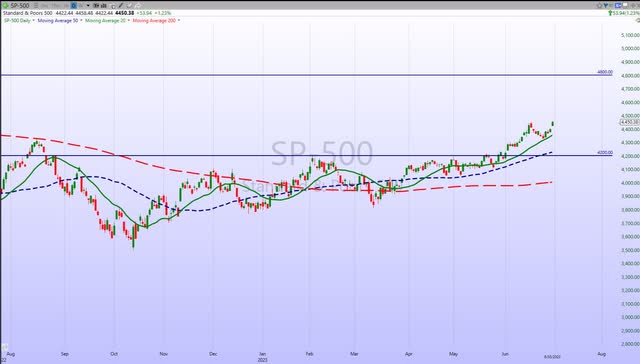
With the S&P remaining overbought in the near term, we can expect a pause in this rally at any time. As long as the index rides that ascending trend line the rally continues. However, even a break there won’t upset the intermediate-term trend as there appears to be plenty of strong support in the 4200 range.
Investment Backdrop
The S&P 500 has spent the entire month of June in “overbought” territory. That’s a good example of how long an overbought or oversold condition can remain in place. When it did pull back, the action looked more like rotations going on under the surface from day to day rather than an all-out sell fest. In other words, it’s more corrective in nature rather than the start of a deep dive.
Technicians were on the lookout that a false breakout/blow-off top has occurred. The S&P almost immediately pulled back after breaking the 4400 resistance and before Friday’s rally closed below that level for nine straight days. With an S&P close at S&P 4450, that price action takes the idea this was a false breakout off the table.
The month of June and the second quarter is in the books and it was a sea of “green”. I’ll post the June and end-of-quarter results next week. One notable result; despite the obvious love affair with Technology, there are more signals hinting that the rally is broadening out.
Small Caps
Until this week, the Russell 2000 seemed destined to stay in a narrow trading range. The (IWM) shows a series of LOWER highs and that is not confirming the NEW BULL market scenario. However, the small-cap index staged a rally this week that eclipsed the early June highs. That could be the first sign the index is ready to catch up to the rest of the market. The BULLS would like to see some money start to rotate to this group to broaden out the rally.
Sectors
Consumer Discretionary
This sector continues to roll higher in what can only be called a pristine uptrend in ’23. Amazon (AMZN) is helping propel the sector (XLY) higher but I also see across-the-board gains. Unlike last year when the sector lost 36% over fears of a recession, investors have fully embraced a soft landing scenario that has produced a 31% YTD gain. This a prime example of sentiment fueling emotion that feeds the FEAR and GREED cycles.
Energy
OPEC says global oil demand will rise to 110 million barrels a day in two decades, bringing the world’s energy demand up 23%. That isn’t aligned with all of the other experts who see the push to EVs as slowing demand.
It is nearly impossible to forecast oil prices out that far, but the one issue that the Saudis may be factoring in. Fossil fuels will be in demand to produce electricity to power all those EVs.
Energy (XLE) continues on a roller coaster as the entire sector clings to its LONG TERM support at $77-$78. In the short term, it’s once again at the bottom of its trading range. An area that has been visited multiple times this year. A 5-day end-of-month rally was a welcome sight for the Energy BULLS.
Natural Gas
Natural GAS (UNG) may finally give me a reason to cheer. The reversal that we discussed a few weeks ago continues to play out. Before I break out the champagne, (UNG) is going to have to successfully and decisively clear the $7.70-$7.75 level. If it can, there is an eventual path to the $9 range.
Financials
The Financial sector ETF (XLF) gave investors the impression it was about to join the rally, but those ideas have been dashed. The ETF was rebuffed at resistance two weeks ago, but once ago mustered a rally that finally cleared that level on Friday. The Large cap banks remain in a LONG TERM BEAR trend, and we will need to see a continuation of the recent move to change that.
Regional Banks Try to Complete Possible Bottoming Pattern
The banking crisis back in March feels like a lifetime ago now. While the Regional Banks still have a lot of work to do to try to recover the damage done back then, they are attempting to create what looks to be some sort of Inverse Head and Shoulders-type pattern.
The $40-41 zone on the SPDR S&P Regional Banking ETF (KRE) has been important as both support and resistance over the past few months and the ETF has returned to that level again.
It is no surprise the Regional Banks and Small Caps still seem for the most part to be trading together. Here, too, any longer-term investor who is itching to buy may take some chances against this support area without taking much risk.
Healthcare
Sideways trading in the Healthcare ETF (XLV) continues. This sector has been a disappointment YTD and since the October lows. There are signs that a mini uptrend might start to form and that would make sense as I can see the sector attracting money as the HOT sectors sell-off.
Biotech
The Biotech ETF (XBI) has pulled back during the recent market weakness and was left sitting at a short-term support level. I sent out a note to members of my service on Monday indicating a price level that represented a decent risk/reward setup. This comes at a time when XBI shows signs of overcoming longer-term resistance.
Traders can use the $80-$81 range as a mental stop. With the ETF closing at $83 on Friday, your risk is identified, and if we do get a breakout, there is plenty of upside ahead.
While it is not being fueled by the AI craze, it is now seen as a “growth” area of the market, and anything growth is now in favor.
Commodities
Every time it appears the commodity complex (DBC) may start to make a move higher it simply retreats and the series of lower HIGHs keeps the group in a BEAR trend. It’s perhaps another indication that the global economy will remain subdued and could be ready to slip into recession. It’s also a signal that inflation will continue its downward trend.
Gold and Silver
My concerns regarding the Gold ETF (GLD) have come to fruition. The ETF has rolled over in the short term and is searching for support. We can now safely say the strong resistance levels that were highlighted in early May around the $193 level have once again proven too strong. Once again that leaves a sideways trading range as the most probable pattern for the near term.
Silver (SLV) has followed the same path and on Monday the ETF moved down to a level I considered a good support zone ($20-$21). That prompted me to buy back the “trading” shares that were sold in the prior week for a double-digit gain. In the interim. I continue to also maintain a CORE position for the longer term.
Uranium
After a strong rally, the Uranium ETF (URA) has pulled back to initial support. Similar to SLV, I have a CORE position along with a block of shares I use for trading. The last trade turned out to be positive, and I’ll be looking to re-enter the ETF in the $20-$21 range as a “trade”. The ETF closed just above my entry zone to end the week at $21.53.
Technology
With the Nasdaq having the third-best first half (+31%) in its history, it has been as close to a perfect year as one could imagine for the index.
Semiconductors Sub-Sector
The semiconductor ETF (SOXX) started to show signs of rolling over, but the BULLS sent a message they are still very much interested in this group of stocks.
During the week there were headline reports of potential new restrictions on chip exports to China and that stirred up some early selling in the Chip sector. However, it seems clear that these momentum names aren’t going to give up the gains so quickly. There are buyers just waiting for ANY weakness to show up and this week’s action was another sign that should add confidence to the strategy of all active investors. Dips are being bought.
Bitcoin
Crypto Wakes Up to Join the Party
While I haven’t been trading it, I’ve often used the action in Bitcoin as an indicator of a risk-on environment for stocks. One curious aspect of the recent Tech-led rally is that Bitcoin wasn’t participating. Below is the Grayscale Bitcoin Trust (OTC:GBTC) which tracks the cryptocurrency and while it did quite well from November into April, it was mostly drifting downward even while stocks were rallying.
It has come back to life recently, and it could be a sign that market participants are beginning to look elsewhere for some alpha as the Tech leaders go into pause mode. Investors seem eager to keep the “risk-on” backdrop in place.
Final Thoughts
The second quarter came to an end this week. That will help to steer the focus on Wall Street back to the fundamentals as analysts and investors weigh the data on where we have been and set out expectations for where things are headed from here. As we near the midway point of 2023, several things are quite clear. Inflationary pressures have been largely tamed – at least compared to where things stood from 2020 through late last year. Try as they might, OPEC+ has failed to boost crude oil prices. That has offered up millions of households and businesses some much-needed relief at the gas pumps – with the price of that key product down by nearly 30 percent in the past full year.
It’s been drilled into our brains– At the end of the day, only “price” matters. If the stock market continues to shrug off all of the risks that remain, it will create high-probability, low-risk entry points that aggressive traders can use to take more chances. The glass-half-full sentiment is your tailwind and that does “unlock” more potential on the upside as long as dips remain mild and hold above support. So it’s another one of those periods where market participants have to walk a “fine line”.
If this is truly the beginning of a new BULL trend there will be an abundance of opportunity offered. However, there is also this fact to consider. While we’ve seen new highs and a BEAR market low, the S&P is trading at the same level it was in June ’21. That is two years of anxiety and zero performance and should lead the ‘average’ investor to contemplate the no-risk returns offered today.
I continue to stress that strategy as well as a way to round out investors’ positioning now, while they wade through the many uncertainties.
ENJOY the LONG WEEKEND and the JULY 4th Holiday!
THANKS to all of the readers that contribute to this forum to make these articles a better experience for everyone.
Best of Luck to Everyone!
Read the full article here


