
Support Calls For Measured Approach
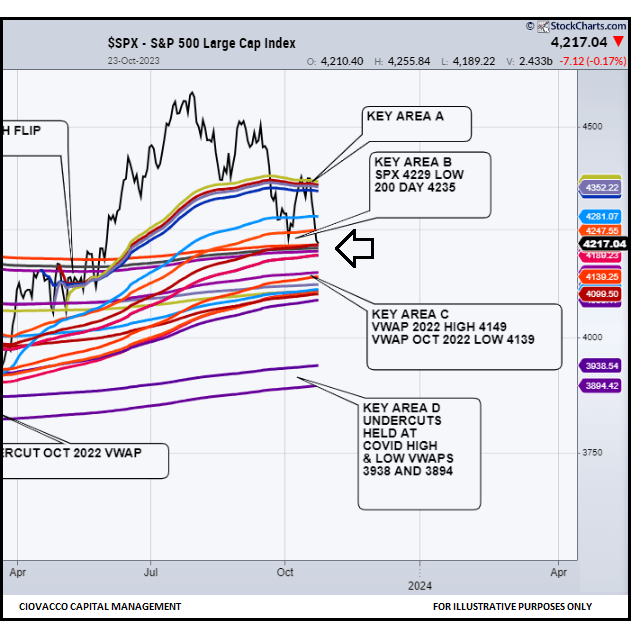
As shown on the S&P 500 anchored volume weighted average price (AVWAP) chart below, dated Monday, October 23, the S&P 500 has not yet violated the major band of possible support. The chart below and the content in this post speak to the intermediate-term outlook for the SPDR S&P 500 ETF (NYSEARCA:SPY).
CCM / StockCharts.com
Deficit Spending and Interest Rates
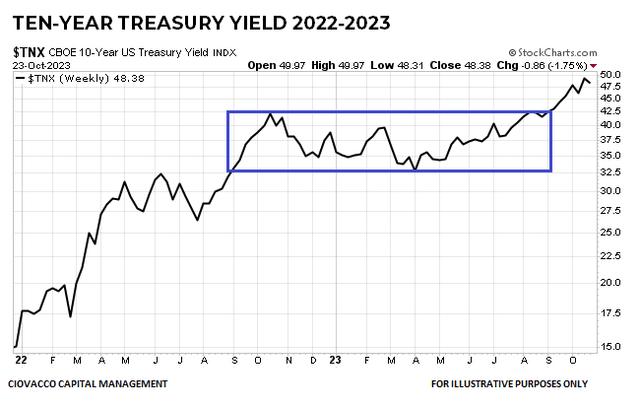
The bond market has been taking note of ballooning federal deficits, impacting interest rates and the stock market. From Reuters:
WASHINGTON, Oct 20 (Reuters) – The U.S. government on Friday posted a $1.695 trillion budget deficit in fiscal 2023, a 23% jump from the prior year as revenues fell and outlays for Social Security, Medicare and record-high interest costs on the federal debt rose. The deficit comes as Biden is asking Congress for $100 billion in new foreign aid and security spending, including $60 billion for Ukraine and $14 billion for Israel, along with funding for U.S. border security and the Indo-Pacific region.
As concerns about government spending increased, the yield on a ten-year Treasury started pushing higher in September after moving sideways for several months.
CCM / StockCharts.com
How Much Damage?
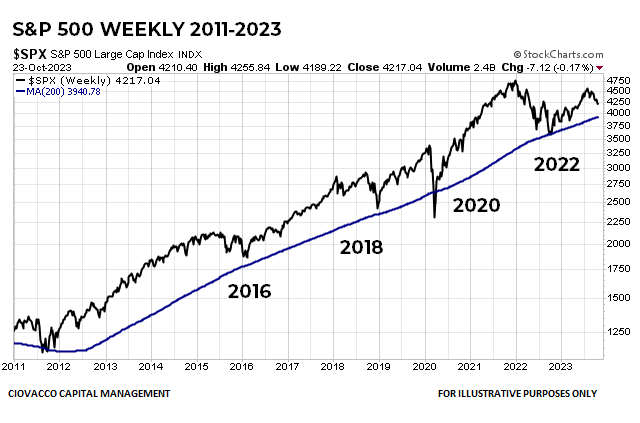
While the market remains in risk-off mode, thus far, the market’s primary trend remains intact. The S&P 500 made a stand at the 200-week moving average in October 2022, similar to the stands made in 2016, 2018, and 2020.
CCM / StockCharts.com
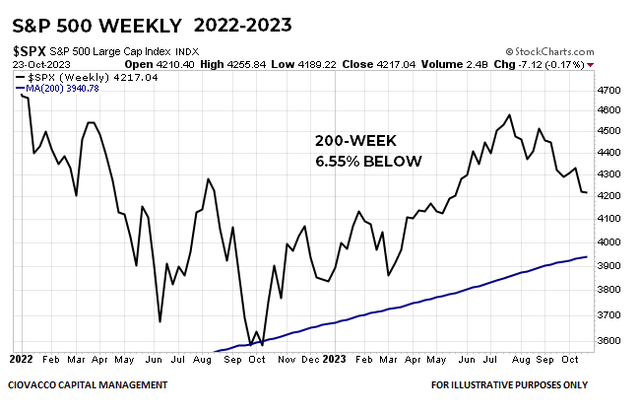
As of the October 23 close, the S&P 500 remains 6.55% above the upward-sloping 200-week moving average. Notice the slope of the 200-week remains firmly up at this point, which is indicative of a strong long-term trend. If the price drops below the 200-week and the slope flattens out/rolls over, concerns would increase.
CCM / StockCharts.com
Some Noteworthy Developments
Last week, the S&P 500 was down 27 points on Thursday and 21 points on Friday, which resulted in a close below the prior rally attempt low, made on October 3, 2023 at 4229. The S&P 500 traded above 4229 during most of the session Friday, but failed to hold it during the last ten minutes of trading. Failing to hold 4229 and continuing a string of late-week selloffs tell us to continue to respect the negative impact of higher interest rates. If the S&P 500 can push back above 4229, and move away from 4229, last week’s move could be classified as a successful retest of the October 3 low.
Recent weakness also caused the S&P 500’s 10-week moving average to drop below the 20-week moving average for the first time since December 2022. The moving average crossover is indicative of incremental deterioration in the market’s longer-term uptrend.
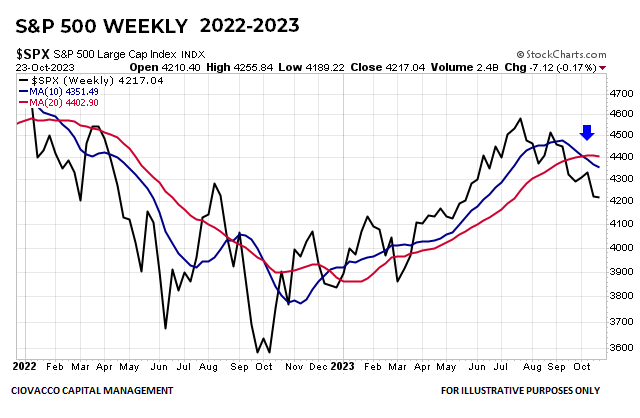
CCM / StockCharts.com
When the market’s underlying trend is strong, the 10-week closing below the 20-week can be a non-event. For example, when the signal occurred on June 1, 2012, and December 7, 2012, the market found its footing quickly and continued to march higher (see chart below). Similarly, after the major S&P 500 low in February 2016, the 10-week closed below the 20-week on November 4, 2016, and the stock market quickly returned to a favorable uptrend.
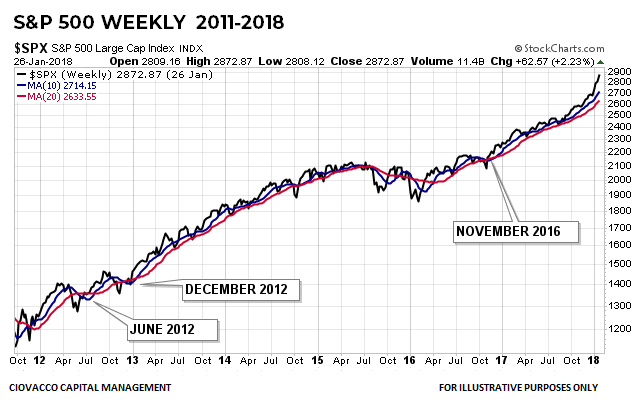
CCM / StockCharts.com
Regardless of the outcomes in 2012 and 2016, it is not a good idea to ignore evidence of a waning uptrend. We examined similar bearish crosses in the context of secular bull markets, focusing on the 1956-1968 and 1989-2000 windows. In the twenty-three historical cases, the subsequent median twelve-month maximum S&P 500 drawdown was 7.17%. A similar drawdown in 2023 would hypothetically bring the S&P 500 down to 4017, which is between areas C and D in the AVWAP chart shown earlier in this post.
The daily chart of the S&P 500 below shows the price testing the one-year base that was built between May 2022 and May 2023. The price was rejected at 4195 in February, telling us this area of prior resistance now represents an area of possible support. Monday’s close was 4217, after trading as low as 4189 intraday. A sustained break below 4195 and back into the prior base would be another negative development. A successful retest of the upward-sloping red 200-day moving average would not be particularly out of character for a new advance. Conversely, an extended stay below the 200-day would negate the positive impact of the June breakout above the long-term base.
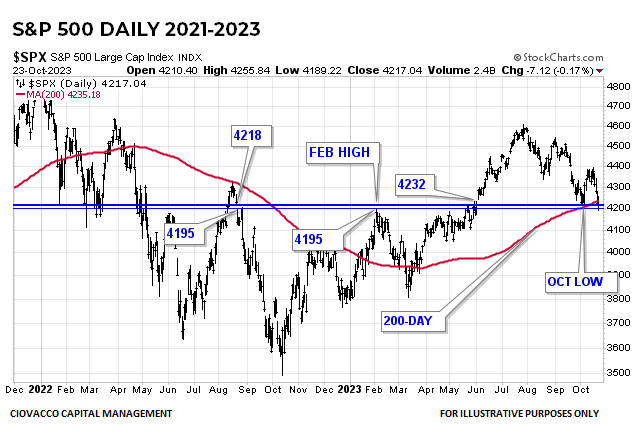
CCM / StockCharts.com
DeMark Trend Exhaustion
In addition to taking the primary trend and areas of possible support into consideration, it is also good to be aware of the DeMark 9-13 combo count that was recently completed on the S&P 500’s daily chart. The signal speaks to increasing odds of selling exhaustion and a bullish reversal, with an emphasis on the term odds.
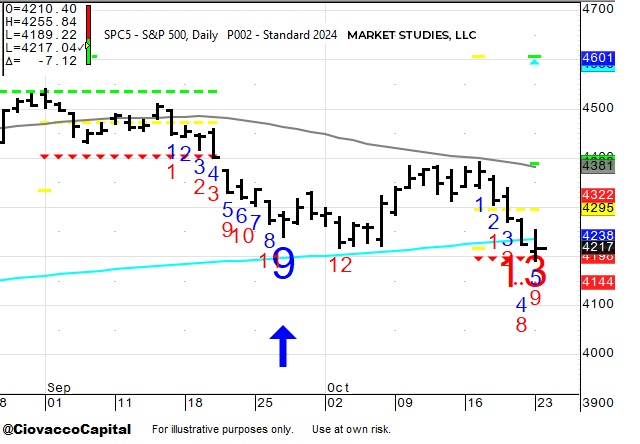
CCM / Market Studies, LLC
Downtrend vs. Longer-Term Uptrend
As noted numerous times in recent weeks, the bears control the short-term tape and the bulls have been unable to flip the script. However, that statement applies to every stock market correction that occurs within the context of a longer-term uptrend.
Other forms of evidence that tell us to keep an open mind about a resumption of the primary trend are the slopes of the 200-day and 200-week moving averages shown below. When price undercuts a flat or negative-sloped moving average the odds of the price remaining below the moving average are higher. Conversely, the still-steep slopes below speak to a stronger trend, which means if price undercuts the moving average, the odds are higher that the price will revisit or recapture the moving average. The slopes below say it is prudent to include the terms “patient” and “measured” in our contingency plan.
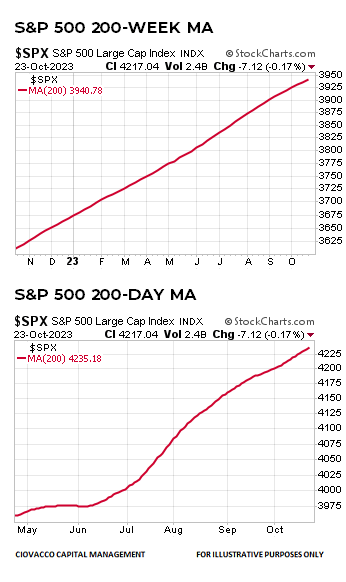
CCM / StockCharts.com
VIX Tame For Now
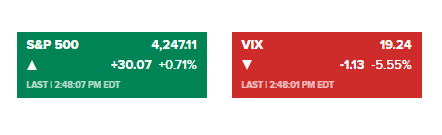
As outlined in detail on October 9, concerns would increase if the VIX (VXX) has a daily close above 25. During Tuesday’s session, the S&P 500 was above 4200 and the VIX was trading under 20.
CNBC.com
No Assumptions Either Way
If the market can make a stand near support, we will happily take our contingency drawdown mitigation plan and toss it in the trash can. If things continue to deteriorate and/or cause abnormal stress in the markets, we will not be caught flat-footed. We will see how it plays out in the coming days and weeks.
Read the full article here

