
Investors seem to be questioning the sustainability of Winnebago Industries’s (NYSE:WGO) revenue and operating margin gains. Winnebago’s TTM revenues are roughly twice pre-COVID levels, and Winnebago’s operating margins were 4-5% higher than 2017-2019 levels at one point. However, I believe that much of Winnebago’s revenue and operating margin gains are permanent. My view is that the market is underestimating Winnebago’s future revenues and operating margins, creating an opportunity for investors to earn ~18% annual returns over the next few years.
Company Overview
Winnebago was initially in the motorhome business but entered the towable RV business in the 2010s. Towable RVs have grown in popularity, presumably because they’re smaller, cheaper, and easier to maintain.
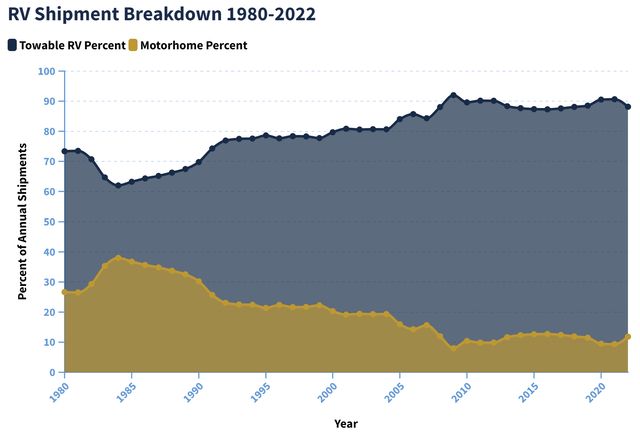
RVIA
Winnebago acquired Grand Design (a towable RV company) in 2016, resulting in its revenue more than doubling from 2016 to 2018. Additionally, Winnebago entered the boating industry by acquiring Chris-Craft in 2018 and Barletta in 2021. Winnebago also acquired Newmar (a motorhome business) in 2019 and recently announced it was acquiring Lithionics (a battery company), but I believe these acquisitions are less important. Using normalized numbers, roughly 10% of Winnebago’s revenue comes from Barletta and Chris-Craft, whereas 90% of Winnebago’s revenue comes from RVs.
The Growth Story
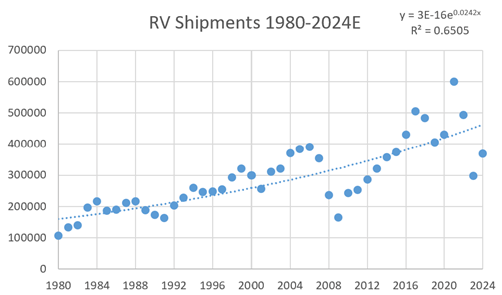
RVIA
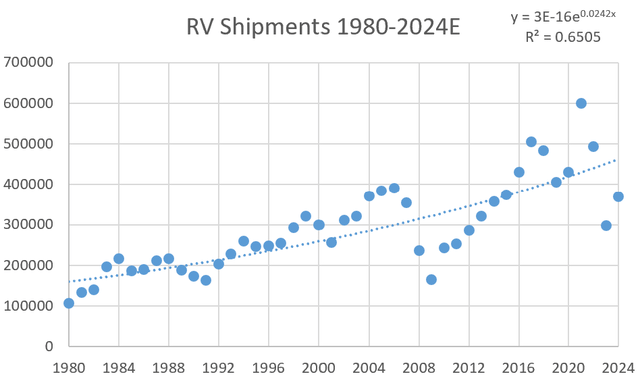
RV shipments grew only 2.42% annually from 1980-2024. Although the industry is mature, I believe that Winnebago’s underlying growth over the last few years was much higher than the economy’s growth rate for a couple of reasons.
Secular Growth
The pandemic accelerated growth for the RV industry, given that RV household penetration is increasing. In Winnebago’s Q3 conference call, management noted that people are using campers as a more affordable alternative to hotels. Additionally, 52% of Winnebago Industries’ third annual Spotlight Survey respondents said they’d increase outdoor activity to reduce stress (up from 2022 results). First-time buyers have also been at record levels, so overall awareness and acceptance of RVs has improved.
Market Share Growth
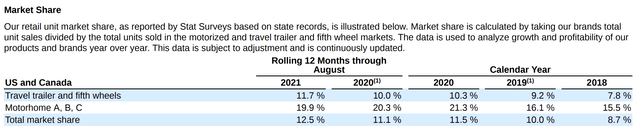
Winnebago Investor Relations
Winnebago’s market share growth from 2018 to 2021 in the travel trailer and fifth wheels segment was impressive, thanks to its Grand Design brand. Although Winnebago has lost market share since 2021 (due to management being cautious and reducing field inventory), management expects Winnebago’s market share to reach 15% over time.
Margin Expansion
Favorable Product Mix
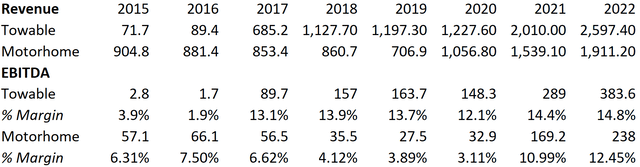
S&P Capital IQ
Winnebago purchasing Grand Design in 2016, Chris-Craft in 2018, and Barletta in 2021 has led to significant margin expansion because towable RVs (Grand Design) and boats (Chris-Craft and Barletta) are higher margin products than motorhomes. I believe that margins will continue to expand because Winnebago’s Grand Design brand (towable segment) will likely experience more underlying growth than Winnebago’s motorhome segment for two reasons:
- Motorhomes are making up a smaller percentage of annual RV shipments
- Revenue for the towable segment was flat in 2019 despite industry RV shipments declining by 16% in 2019 (I think this represents strong organic growth)
While the motorhome segment has grown at an impressive rate over the past four years, I believe the growth was one-off because it was driven by price increases rather than volume increases. In the future, I expect towable volumes to grow more quickly than motorhome volumes.
Sticky Price Increases
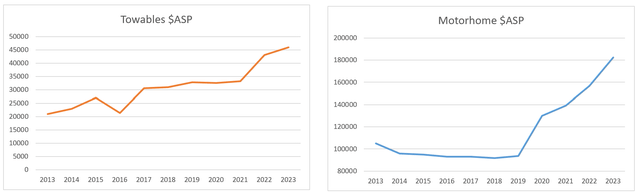
Winnebago Investor Relations
Towable average selling price (ASP) increased sharply after Winnebago acquired Grand Design in 2016. Currently, towable ASP is ~40% higher than 2019 levels, whereas motorhome ASP is ~95% higher than 2019 levels. However, I believe that these price increases are sustainable for a few reasons:
- Winnebago’s acquisition of Newmar in 2019 contributed to ASP increasing in 2020 (Newmar is a luxury brand)
- The RV industry is an oligopoly because Winnebago, THOR Industries, and Forest River make up 90% of sales. Winnebago’s management expressed that they are reactive when setting prices (the industry sets prices based on THOR/Forest River). This means that THOR/Forest River can keep prices high to pass on cost inflation to the consumer and maintain high gross profit margins
- ASPs have remained high despite volumes falling in recent quarters. Plus, there is substantial evidence in support of volumes increasing over the next few quarters. 2024 RV volume estimates from RVIA are higher than 2023 RV volume estimates, and management indicated that the demand environment should strengthen when they said, “we’re nearing a point here in the next six months, especially on the RV business, where most, if not all, of that destocking appetite from dealers will probably be filled”
- Management supported the higher ASP story in their latest conference call when they predicted that gross margins would eventually reach 19% (record levels)
Comparable Analysis
S&P Capital IQ
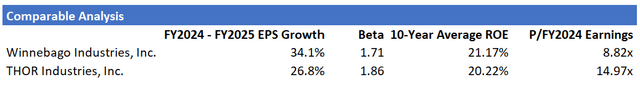
Winnebago looks cheap compared to THOR Industries (the most similar company to Winnebago), which is trading at nearly 15x consensus 2024 earnings. Both companies have similar growth (EPS growth), risk (beta), and capital efficiency (return on equity), so I believe they should be trading more closely. Given the multiple discrepancy, a long-short trade looks interesting.
Intrinsic Value
Bear Case
Daniel B. Wilson
Bull Case
Daniel B. Wilson
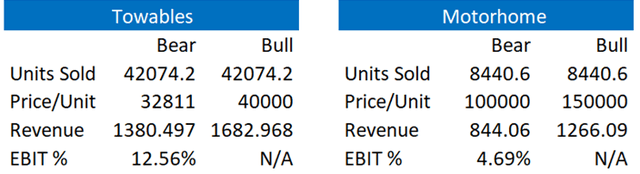
Base Year Revenue: I estimated Winnebago’s normalized marine segment revenue based on MasterCraft’s revenue (I couldn’t find pre-COVID revenue for the marine segment). The towable and motorhome segments’ revenue was calculated by multiplying ASP by units sold. I estimated ASP and units sold below.
RVIA
Shipment volumes peaked in 2021 and were ~30% higher than the exponential line of best fit in 2024. I normalized shipping volumes by reducing peak units sold in each segment by 30% (motorhome volumes peaked in 22′, towable volumes peaked in 21′).
Price/Unit: I assume this number reverts to roughly its historical average in my bear case. In my bull case, I assume this number stays elevated for motorhomes and towable RVs but declines slightly from current levels due to unfavorable short-term conditions.
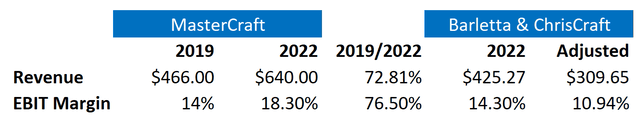
Marine Revenue & Bear Case EBIT Margin: To adjust for revenues being boosted by COVID, I multiplied MasterCraft’s (2019 Revenue)/(2022 Revenue) ratio by Barletta and ChrisCraft’s 2022 revenue. I also applied the (2019 EBIT Margin)/(2022 EBIT Magin) ratio to estimate Barletta & ChrisCraft’s operating margin during normal times.
Daniel B. Wilson
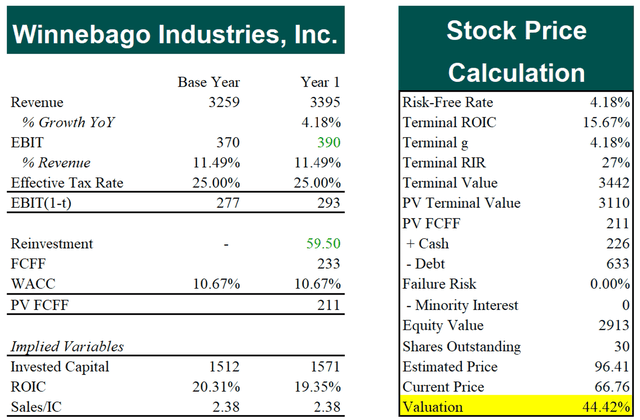
EBIT Margin (Bull Case): I started with management’s gross margin target of 19%. Winnebago’s gross margin was 7.51% higher than its EBIT margin from 2017-2019, so I subtracted 7.51% from 19% to get 11.49%.
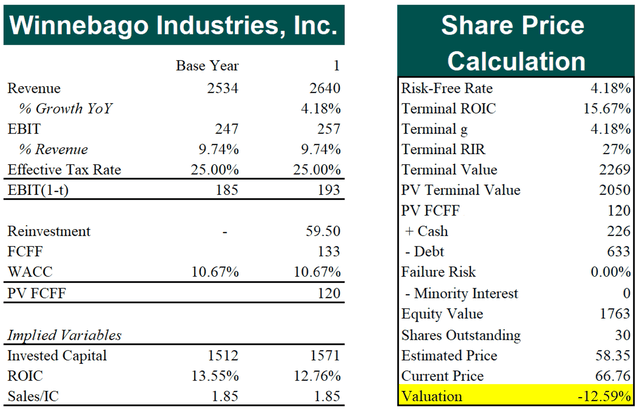
EBIT Margin (Bear Case): Weighted average EBIT margin based on normalized revenues and operating margins from each segment. EBIT margins for the towable and motorhome segments were based on historical averages (towable: 2017-2019; motorhome: 2015-2019). Management only provided EBITDA margins for each segment, but D&A was roughly 1% of revenue historically, so I subtracted 1% from the average EBITDA margins to get EBIT margins.
Daniel B. Wilson
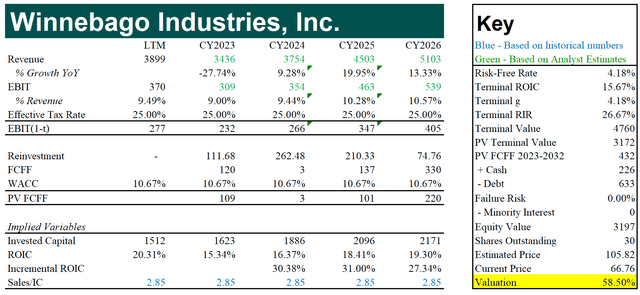
Weighted Average Cost of Capital (WACC): CAPM; Aswath Damodaran’s implied ERP of 4.9%; BB credit default spread added risk-free rate for the cost of debt; 5-year historical beta.
Reinvestment: (Change in revenue in the following year)/(Sales/(Invested Capital)). The Sales/IC (invested capital) ratio is constant because I assume capital efficiency stays the same.
Terminal ROIC: This is 5% above Winnebago’s WACC. I make this assumption because the oligopolistic nature of the industry should allow companies to earn more than their WACC on new projects.
Terminal g: Risk-free rate (a proxy for the growth rate of the economy)
Terminal Reinvestment Rate (RIR): (Terminal g)/(Terminal ROIC)
Terminal Value: ((EBIT*(1-(tax rate))*(1-(Terminal RIR))*(1+g)))/(WACC-(Terminal g))
Analyst Estimate DCF
S&P Capital IQ
Analyst revenue expectations are far more optimistic than mine, but their operating margin expectations are in between my bearish and bullish assumptions.
Final Calculation
Daniel B. Wilson
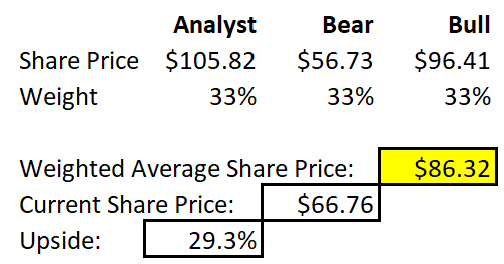
I believe each scenario is equally possible, so I weighted each scenario the same.

Daniel B. Wilson
Theoretically, companies should increase in value by their cost of equity annually if they are priced correctly. Winnebago has a cost of equity of 12.5%, so if $86.32/share is fair value for Winnebago, it will be a $155 stock in five years (the value of equity increases by 12.54% annually). If the market also values Winnebago at $155/share in five years, Winnebago shareholders will have made 18.5% annually.
Thesis Risks
The obvious risk is macro. Winnebago’s revenues dropped 80%+ from its peak in 2004 to ~200 million in 2009 (because of the GFC). However, I would push back on this risk by pointing out that the entire stock market is priced for a soft landing/no landing scenario (the S&P 500 is at 4500, and top-down analysts for the S&P estimate strong earnings growth in 2024 and 2025).
Macro risk can also be minimized by shorting THOR Industries. As I noted earlier, THOR Industries looks expensive at current levels.
Conclusion
To me, Winnebago looks very attractive at current levels. I suspect that as conditions normalize, investors will begin to price in higher operating margins and higher revenues. While I’m not as optimistic as the street, I still expect high double-digit returns over the next couple of years because Winnebago looks undervalued and has a high cost of equity.
Read the full article here

