
Investment Thesis
The Vanguard S&P Small Cap 600 Value ETF (NYSEARCA:VIOV) is a low-quality ETF with a misleading valuation, evidenced by 16% of the fund by weight having negative expected earnings. Over the last few years, several higher-quality multi-factor ETFs have emerged and outperformed VIOV, and although there are worse options, readers don’t need this small-cap value fund. In this article, I look forward to highlighting VIOV’s fundamentals in more detail and comparing it with two worthy alternatives you should consider.
VIOV Overview
Strategy Discussion
VIOV tracks the S&P SmallCap 600 Value Index, a market-cap-weighted benchmark, selecting small-cap stocks based on their value scores using three factors: the ratios of book value, earnings, and sales to price. All S&P SmallCap 600 companies are assigned a growth score based on the ratio of three-year earnings per share over price, three-year sales per share growth rate, and twelve-month price change. S&P style baskets are created based on these growth and value scores, but unlike the Pure Value Indices, some overlap is permitted. There is currently a 28% overlap by weight between VIOV and the Vanguard Small Cap 600 Growth ETF (VIOG), with VIOV overweighting Consumer Discretionary and underweighting Technology.
ETF Research Center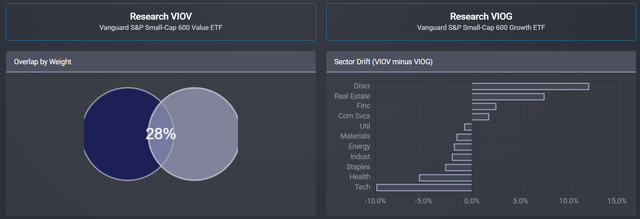
The composition is interesting, with VIOV several volatile sectors like Consumer Discretionary and Real Estate overweighted. Meanwhile, defensive sectors like Consumer Staples and Health care are underweighted. The result is that VIOV realized higher volatility since its inception, as measured by its 20.30% annualized standard deviation figure. VIOV also underperformed since its September 2010 launch, leading to weaker risk-adjusted returns.
Portfolio Visualizer
I mention this because large-cap investors are used to value ETFs as less volatile, “safer” options. To illustrate, here are the figures for the Vanguard Value ETF (VTV) and the Vanguard Growth ETF (VUG), which I recently covered. Notice that VTV’s 14.15% standard deviation figure is 2.22% less on an absolute basis (13.56% on a relative basis).
Portfolio Visualizer
The takeaway is to forget about VIOV offering any safety in market downturns. Instead, try to balance the pros and cons of buying deeply-valued stocks. On the one hand, their valuations are often attractive, but on the other hand, they could be cheaply valued for a reason and have the potential to head much lower. There are some things to remember when evaluating quality and performance that most third-party providers don’t highlight well, and I’ll dig deep into these metrics shortly. But first, let’s evaluate VIOV’s performance against 17 small-cap value peers.
Performance Analysis
The following table highlights periodic returns for VIOV and its peers over the last ten years. Only eleven, including VIOV, have a ten-year history. Still, newer offerings that follow proprietary strategies can potentially give VIOV and other plain-vanilla funds a run for their money.
The Sunday Investor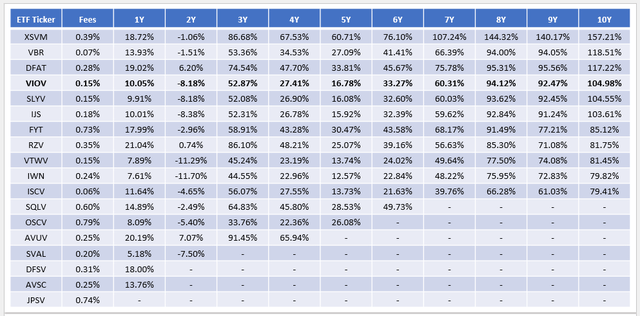
The table reveals how VIOV was the fourth-best performer over the last ten years between October 2013 and September 2023, gaining 104.98%. SLYV lagged by only 0.43%, and that’s because the two ETFs track the same Index. Vanguard’s indexing process is the difference, though it’s negligible.
The Invesco S&P SmallCap Value with Momentum ETF (XSVM) has the best ten-year total returns by far, outpacing VIOV by 52.23%. However, XSVM changed Indexes effective June 21, 2019, so the four-year total returns column is most relevant. Here, XSVM beat VIOV by 40.12% (67.53% vs. 27.41%) despite a higher expense ratio, suggesting that the strategy has merit. I’ll be evaluating XSVM’s fundamentals alongside VIOV.
The Vanguard Small Cap Value ETF (VBR) has the next-best ten-year returns at 118.51%, but it’s not a proper apples-to-apples comparison because it tracks a CRSP Index, which includes several mid-cap value stocks. Instead, I want readers to consider the Dimensional U.S. Targeted Value ETF (DFAT), as its weighted average market capitalization is much closer to VIOV, suggesting it’s a proper small-cap fund. XSVM and DFAT are slightly higher quality, and their longer track records ease investors’ concerns about buying into a higher-fee fund.
VIOV Analysis
Sector Exposures and Sub-Industry Composition
The following table highlights sector exposure differences between VIOV, XSVM, and DFAT. One of the main differences is the underweighting of Energy stocks at 4.67%. XSVM overweights the sector because of its twelve-month momentum screen, last applied based on 2022 returns. DFAT’s active managers likely see some value based on low P/E ratios, but a 10.98% weighting is not too substantial.
Morningstar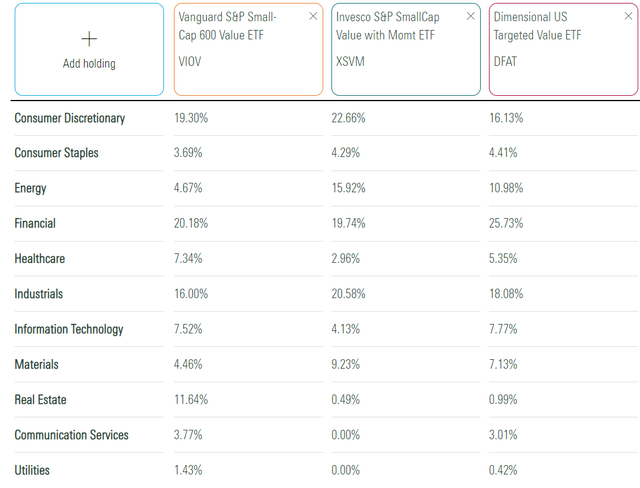
The offset is Real Estate at 11.64%, a sector mostly absent in XSVM and DFAT. All three have 20% or more exposure to Financials, a traditionally cheaply-valued sector. Recall the fall of Regional Banks back in March, so I’d be surprised if we don’t find a number of them across most small-cap value ETFs.
The following table identifies VIOV’s top ten holdings, which total 7.47% of the portfolio. It’s a well-diversified fund because small-cap stocks can graduate to a mid-cap Index as they increase in value, whereas large-cap stocks have nowhere to go. Meritage Homes (MTH) and Insight Enterprises (NSIT) are the two top holdings, followed by Lincoln National (LNC).
Vanguard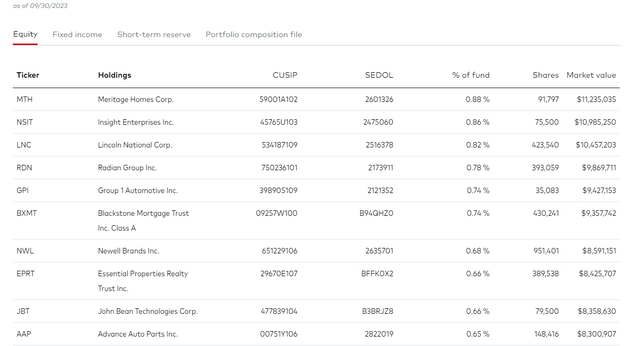
There is also 2.16% allocated to two Vanguard Market Liquidity Funds, as detailed below.
Vanguard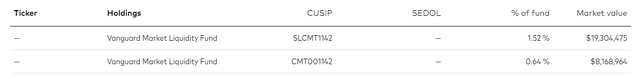
Since the above tables only tell us a little about the fund, I hope you will find the next table more helpful. It lists VIOV’s top 25 sub-industries and the top three holdings in each, where applicable. I’ve also adjusted out the cash holdings, so the weights are slightly higher.
The Sunday Investor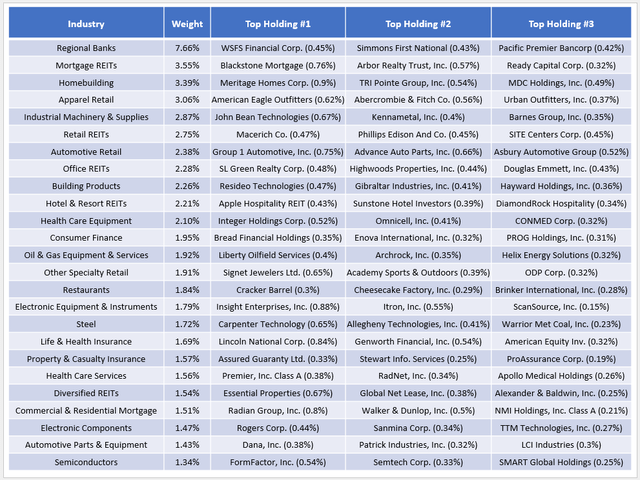
We can see that Regional Banks and Mortgage REITs are the top two sub-industries at 7.66% and 3.55%, followed by Homebuilding (3.39%), Apparel Retail (3.06%), and Industrial Machinery & Supplies & Components (2.87%). Still, these top 25 sub-industries comprise just 57.75% of VIOV, so it truly is a well-diversified portfolio that does its job representing the segment.
VIOV Fundamentals
Here is a look at selected metrics for these same top 25 sub-industries, with summary metrics for VIOV, XSVM, and DFAT in the bottom rows.
The Sunday Investor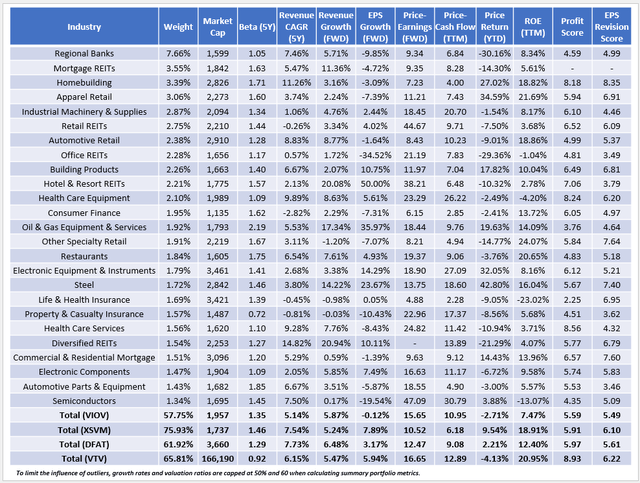
I have three observations:
1. The first metric I want to draw your attention to is VIOV’s low-weighted average trailing return on equity figure of 7.47%. One reason is VIOV’s higher weightings assigned to REITs. VIOV’s average REIT ROE (excluding Mortgage REITs) is 2.28% compared to 12.13% among S&P 500 Index members. It should come as no surprise that small-cap stocks are less profitable, but the significant difference might surprise some readers. In the final row, you can see that VTV’s weighted average ROE is 20.95%, and the multi-factor small-cap ETFs have much better margins. Seeking Alpha’s Factor Grades, which I’ve normalized on a ten-point scale for each ETF, also indicate VIOV is the least profitable at 5.59/10. To be sure, it’s better than what Russell 2000 Value ETFs offer, but the takeaway is that there are just better options.
2. VIOV has -0.12% estimated earnings per share growth, a major red flag, even for a value fund. Regional Banks drag this metric down at -9.85 %, with much of the positive growth coming from the Energy sector. Oil prices are incredibly challenging to predict, but the two wars could cause them to spike. For example, The World Bank predicts that in a “small disruption” scenario, prices would initially rise between 3-13%. A “medium disruption” would drive up prices by 21-35%, while a “large disruption” comparable to the 1973 Arab oil embargo would initially result in a 56-75% price increase. Like many other oil price predictions, these scenarios might not pan out. However, if they do, VIOV is the least well-positioned compared to XSVM and DFAT, with only 4.47% total Energy exposure.
3. VIOV trades at 15.65x forward earnings and 10.95x trailing cash flow. For the growth offered, this is not an attractive feature. Readers should consider an ETF’s valuation alongside profitability. Since the inputs into these valuations only include profitable companies, VIOV is misrepresented, as 15.76% of the fund by weight have negative expected one-year earnings. One solution is to assign a high P/E to these companies, such as 60 (the cap Morningstar uses only for profitable companies), and re-calculate. The math is straightforward: (84.24% x 15.65x) + (15.76% x 60.00x) = 22.64x forward earnings. By comparison, this adjustment is only necessary for 1.45% of VTV, boosting its forward P/E from 16.65x to 17.28x. Therefore, the takeaway is that small-cap value stocks are not undervalued relative to their large-cap counterparts.
Investment Recommendation
With small-cap ETFs, evaluating profitability is crucial. Unfortunately, market-cap-weighted funds like VIOV don’t emphasize it enough apart from the initial profitability requirement for all S&P Composite 1500 issuers. That’s a problem partially addressed by multi-factor funds like XSVM and DFAT, and though their expense ratios are higher, it’s worth it. The result is enhanced profitability, growth, and value metrics and, to date, a stronger long-term track record. I have rated VIOV a “hold” because there are certainly worse options, namely, the iShares Russell 2000 Value ETF (IWN), which offers no profitability screens. Still, I encourage readers to look elsewhere and be willing to pay up for fundamentally stronger portfolios. I have the same fundamental metrics available for all 18 small-cap value ETFs listed today, so if one catches your eye, please ask about it in the comments section below.
Read the full article here

