Introduction
Valuation is always a controversial topic due to its inherent subjectivity. Many investors will arrive at similar conclusions when talking about the characteristics of any given quality company, but few will get to the same answer when trying to answer the following question:
What’s the right price to pay for this business?
The reason is that there’s no right or wrong answer because valuation is not an exact science, even if some may want you to believe that. The output, the intrinsic value, will always be highly dependent on the inputs, the assumptions you make, and these inputs will vary markedly across investors. People reach different conclusions the exact same current data because they see things differently or have other assumptions about the future.
There are many elements that have significant influence over such assumptions.
One of these, very present in financial markets, is price anchoring. Investors tend to judge, often unaware, if a given stock is over/under valued according to its past price performance. This means that if a given stock has advanced significantly in the past, there will be more people claiming that the stock is overvalued than people claiming it’s undervalued.
Similarly, there will be more people claiming that a security is undervalued after a significant drop. The reality is that past stock price returns say little about a company’s current valuation.
We believe Amazon (NASDAQ:AMZN) is an excellent example of this. Many investors continue claiming that the company is overvalued because it “had its run in 2023.” This last part is evidently true, as the stock was up 81% last year:
YCharts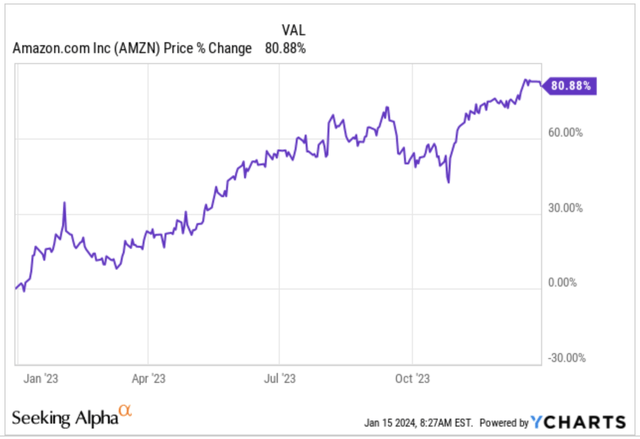
However, the conclusion that stems from that information is not necessarily true. First, we must look at where we come from. Amazon was indeed up 81% in 2023, but the stock is still below 2022 levels. As most of you may know, 2022 was not a great year for Amazon, as it suffered from pandemic hangover, just like the market in general:
YCharts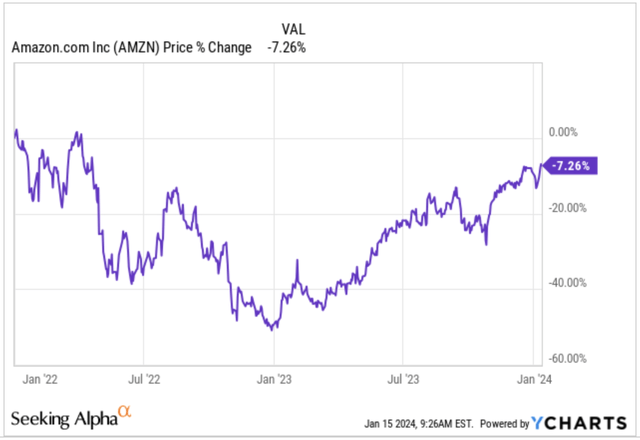
Secondly, Amazon has given a glimpse of its true earnings power throughout 2023. Many investors were indeed aware that the company was underearning, but maybe they did not know that retail can be such a profitable standalone business. The lousy stock price performance in 2022 and the new profitability expectations make 2023’s return pretty misleading when trying to assess current valuation.
The fact that the company’s true underlying earnings power is much more significant than what the current numbers portray also makes current valuation ratios extremely misleading. How many times have you heard that Amazon is expensive because it trades at a given valuation multiple? We have many times, but we certainly don’t feel that’s the case here. Note that Amazon has a culture of continuous reinvestment and reinvention, meaning that it’s unlikely that we’ll see the company’s true earnings power anytime soon.
How I deal with valuation
There are dozens of ways of assessing a company’s valuation and mine might be a little bit unconventional. I typically build an inverse DCF (Discounted Cash Flow Model) to find out what Free Cash Flow growth is baked into the current price.
I then work off of these FCF growth rates and try to build a more detailed model to understand how the different moving parts need to move for the company to achieve that growth in cash flows. Of course, there are hundreds of combinations that will lead investors to any give growth rate in FCF, but I try to go for that one that makes sense. The fact that I look for one “that makes sense” means that fundamental research is essential before building this model.
Once I have built both models, I judge whether what’s baked into the stock price seems reasonable or if it’s too pessimistic/optimistic. Of course this is a highly subjective judgement but that’s how all valuation methods are: subjective. The difference with most others is that I’m totally open about this.
Let’s start with Amazon’s inverse DCF.
Amazon’s inverse DCF
I updated Amazon’s inverse DCF a couple of days ago and realized that the stock is not as expensive as many investors believe. The reason is that, as discussed above, many people suffer from price anchoring; it’s tough to think something is cheap or reasonably valued after an 80% run in 2023.
At the current price, Amazon must grow its Free Cash Flow, or FCF, at a 39% CAGR for the first 5 years and 22% from years 5 to 10 to offer around 12% annual returns:
Made by Best Anchor Stocks
The required FCF growth rates might seem very high, but you’ll see we don’t have to assume anything crazy to get to those; that’s the magic of untapped margin expansion and cash conversion, after all. We should not forget that Amazon is coming from pretty depressed FCF levels, meaning that the starting base is relatively small.
Before going into the more detailed P&L let me share some of my thoughts around the “model assumptions.”
- Discount rate: I tend to set this number between 8-15% depending on the investment’s risk. Investors should maximize for risk-adjusted returns, not just returns. For Amazon, I think that a return of 12% is more than enough to compensate for its risk, maybe even a bit high.
- Terminal growth rate: this is the rate at which the company is expected to continue growing after year 10. I set this number at 4% because I believe the company will be able to achieve this thanks to its exposure to emerging markets, how early we are in the cloud transitions and the white space there is in the eCommerce market.
- Share reduction: I believe Amazon will be able to offset its SBC in the future as it generates more FCF, so I assumed no change in shares outstanding.
I then used the outcome of the inverse DCF (the FCF growth rates) as input for a more detailed model. The objective as I mentioned above is to understand what assumptions we have to make to get to those FCF growth rates. Here’s the more detailed P&L. Probably the numbers are too small, so you can check the model out in detail here:
Made by Best Anchor Stocks
Let me share some brief thoughts on the crucial items.
-
Revenue: I assumed it would grow high-single-digits for the first years and fall to high-mid-single digits for the next 5 due to the company’s scale.
-
Operating margin: I assumed this metric grows the fastest, from a current trailing-twelve-months operating margin of 4.8% to 10% by the decade’s end. Andy Jassy said that pandemic operating margins were not the limit, and those were around 8%, so I don’t think it’s a crazy assumption. Note that there are several margin expansion drivers (higher utilization of the footprint (both in AWS and retail), Ads and AWS making up a larger portion of revenue, price increases…)
I didn’t change much for the remaining variables but I gave a more detailed explanation in the spreadsheet.
I honestly don’t think these are overly optimistic assumptions or that they are out of reach for the company, so I think Amazon can provide a low double-digit IRR (internal rate of return) from here, despite the recent stock rise. I have a decent position already so I will not add at these levels but will surely take advantage of any other opportunity should it present itself.
What’s Amazon’s normalized multiple?
Amazon’s current P/E is high and is typically touted by the bears as the main “bear case.” There are, however, two flaws with that rationale.
First, Amazon enjoys significant working capital benefits, meaning we should look at its cash valuation metrics more than its accounting metrics:
YCharts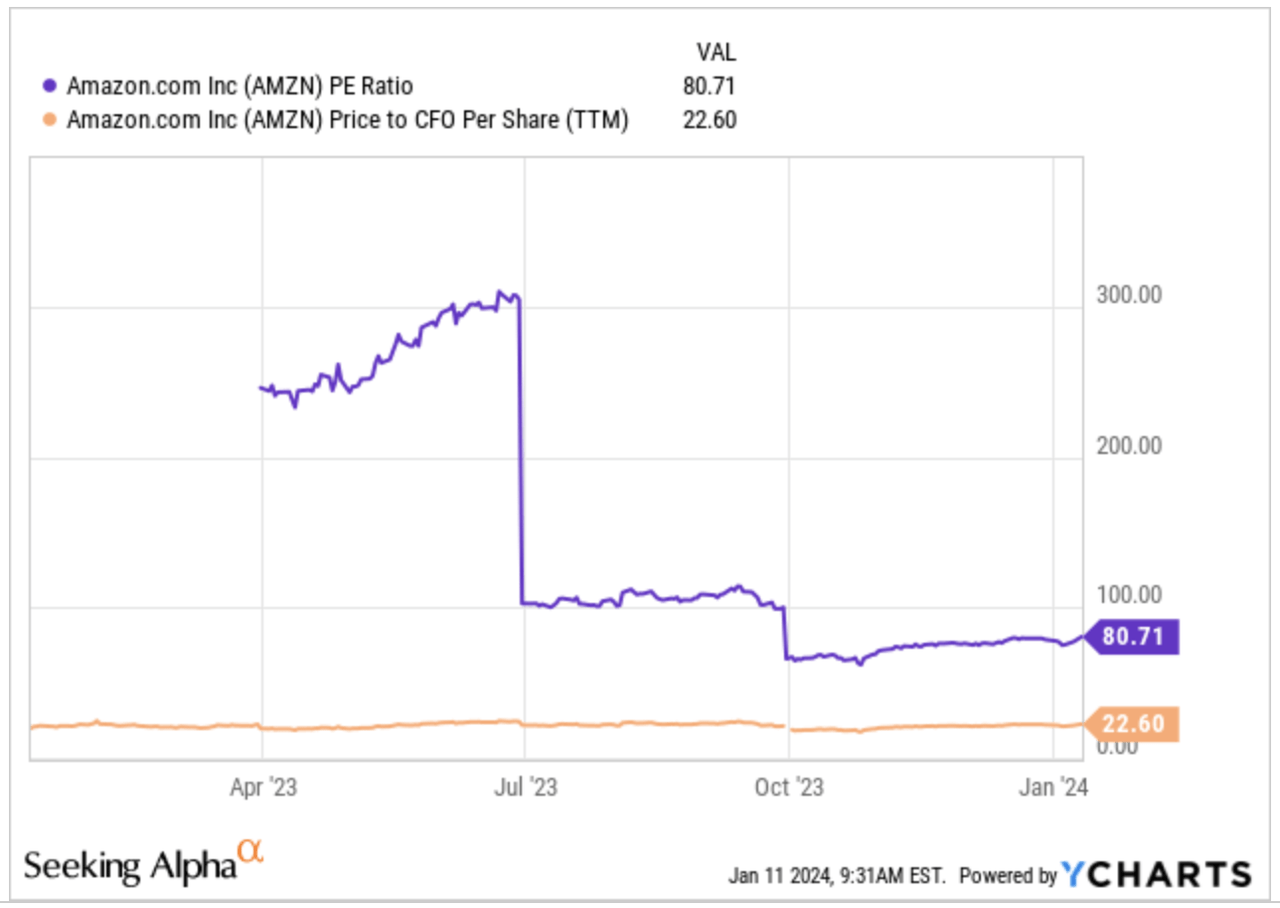
Of course, that comparison is also a bit misleading because Amazon has significant Capex requirements, meaning that the P/OCF ratio is not entirely a fair benchmark. For this, we can look at the P/FCF ratio, which is even higher than the P/E ratio:
YCharts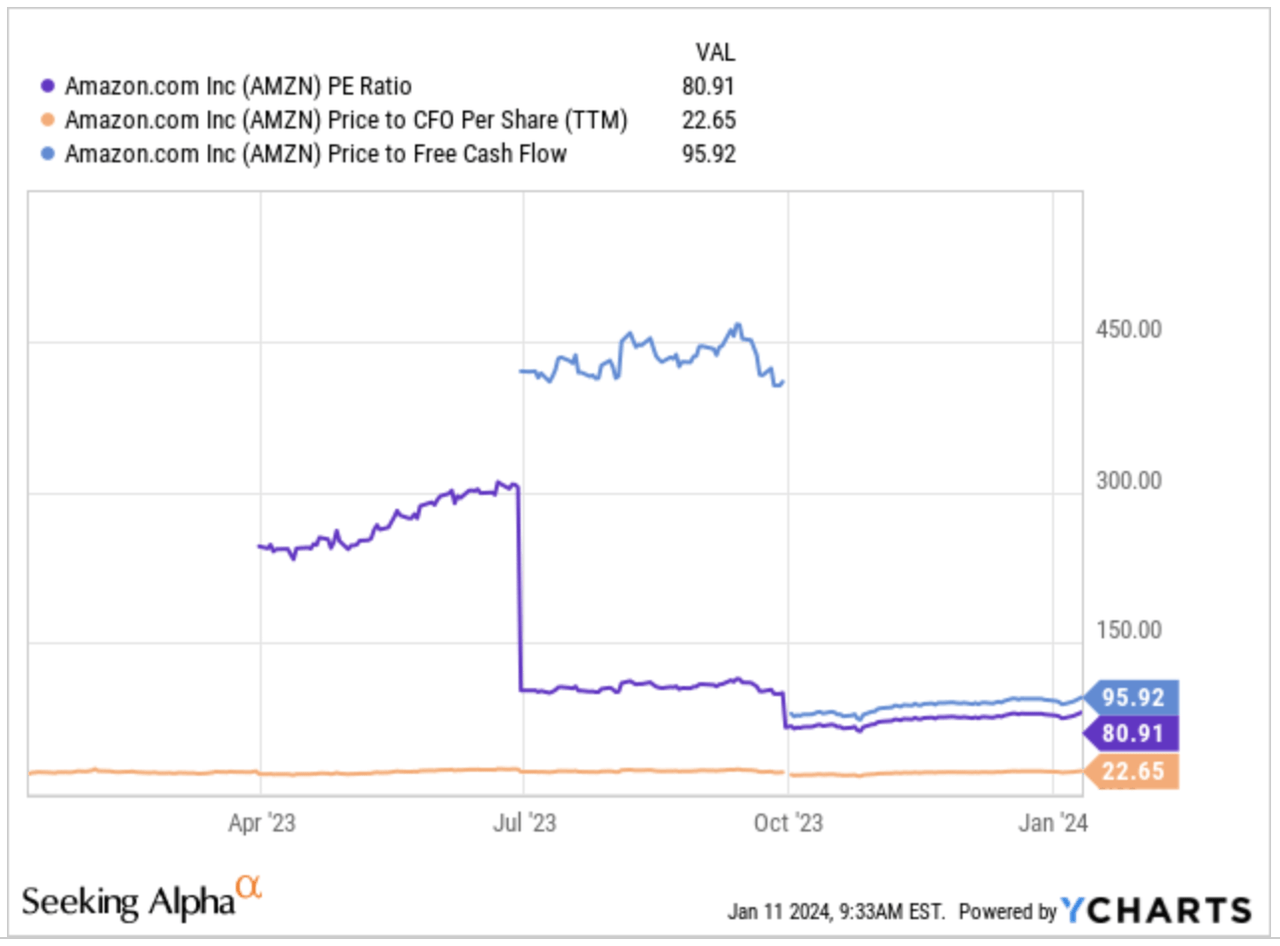
Okay, so what can we do about this?
First, let me explain why these multiples are misleading: because they are backward-looking. All of the above are LTM (Last Twelve Months) multiples and ignore the current margin expansion that Amazon is experiencing. If we were to look at the NTM earnings multiples, we’d see that the landscape is already different:
YCharts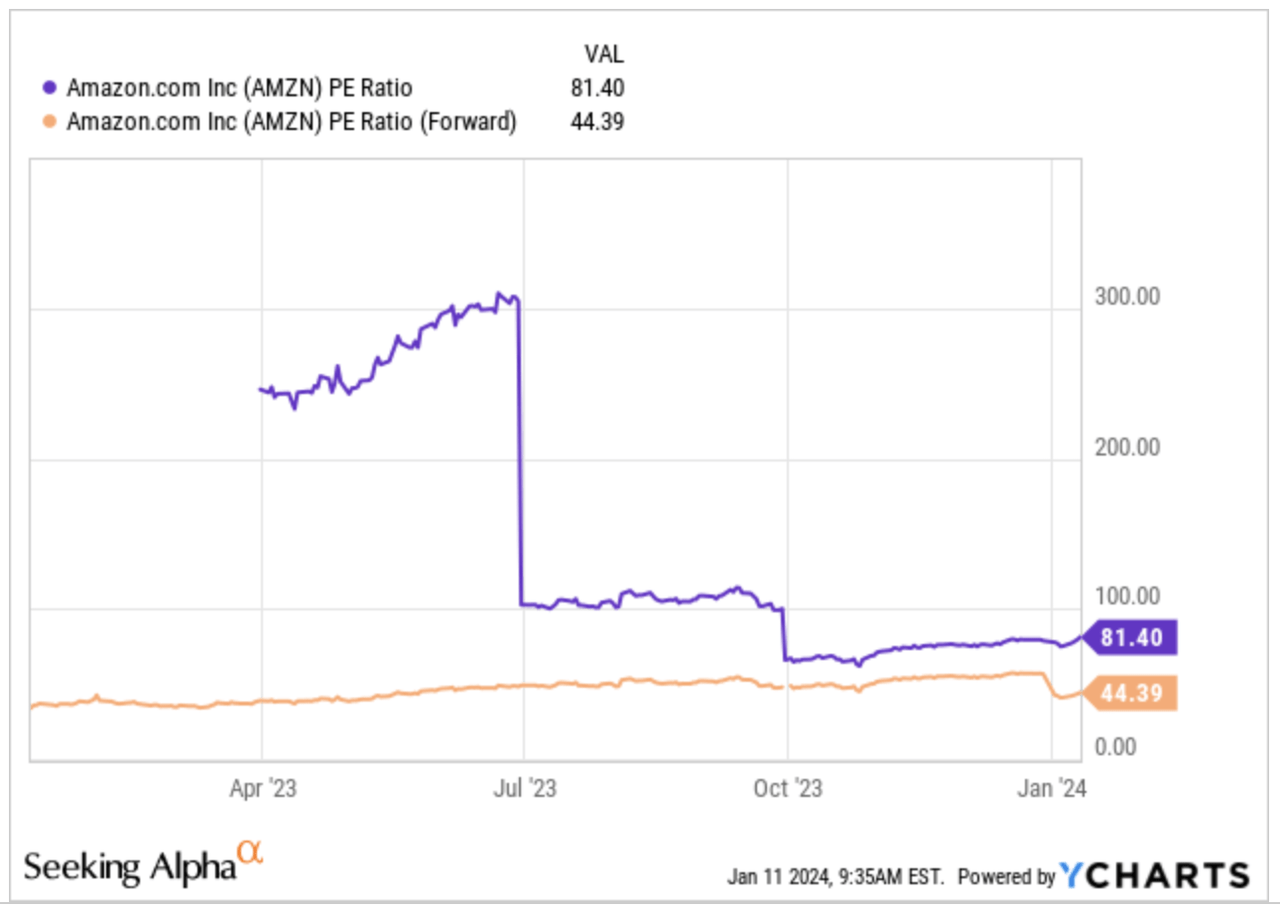
The NTM earnings multiple is almost half of the LTM multiple; why? Because analysts expect significant margin expansion over the next two years (rightly so), generating fast EPS growth:
Koyfin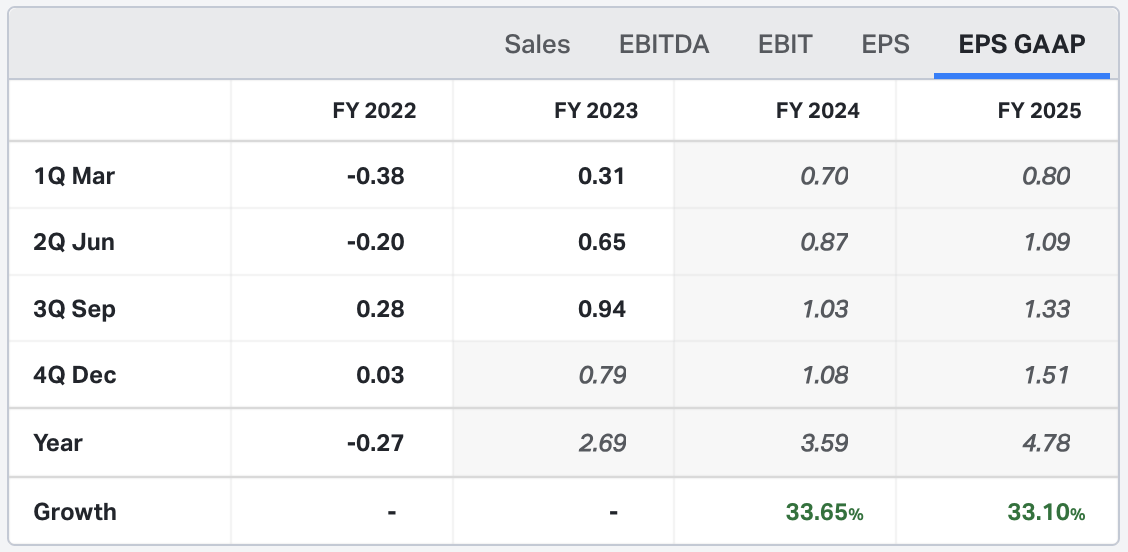
To this, we must add management’s willingness to adjust capacity investments to current demand and make the fulfillment network more efficient. Both actions should provide added benefits in Free Cash Flow conversion on top of the aforementioned margin expansion.
In short, Amazon’s valuation multiples seem so high because quite a few untapped margin and conversion opportunities are embedded in its P&L. Let’s say that Amazon’s normalized operating margin is around 9%, with operating cash conversion (operating cash flow/operating income) around 290% (average of the past years). That would put Amazon at a “normalized” OCF multiple of around 12x, nothing crazy for a company growing in the mid to high single digits with such a strong moat.
Of course, ‘when’ this cash flow is achieved matters, but I just wanted to guide you through what a normalized scenario might look like.
Valuing Amazon is not easy because there are a lot of assumptions to be made about the company’s true earnings power. Consider also that all the optionality the company has is virtually impossible to value because it still doesn’t generate revenue or profits. People who invested in Amazon in 1997 did not know about AWS, but that’s what you get when investing in a continuous reinvention culture.
Conclusion
I don’t feel Amazon is as expensive here as many people make it look like. For sure, the stock enjoyed a great run in 2023 but I’d say that a significant portion of this run was just the market adjusting for the negative sentiment of 2022.
In the meantime, keep growing!
Read the full article here


