With the unhedged position Antero Resources (NYSE:AR) chose combined with low natural gas prices, investors must be vigilant concerning cash generation and management decisions with regard to its usage. In this endeavor, investors must remember a critical difference between negative cash flows and spending, which results in negative cash flow. Sometimes these terms get interchanged. Regarding the former concept, it occurs when the business can’t pay from operations its legal obligations without borrowing or defaulting. In the latter, management chooses negative spending. We have found ourselves at times incorrectly interchanging the two. Now, in the case of many energy companies and others, cash flow and EBITDA are identical or close. Recently, we wrote an article about Resources estimating June cash flow. Our estimate missed the actual result by approximately $100 million, an outcome that certainly needs improvement. Using the June quarter results plus other information, our effort continues. So let’s go.
Comparing The June Quarter with Our Estimate
From our last article, “Antero’s EBITDA for Q2 is estimated to be between $250-$300 million, . . .” The business actually generated an “adjusted EBITDAX [at] $113 million (Non-GAAP); net cash provided by operating activities was $155 million.”
With respect to the two key commodity prices, the company reported:
- [that it] realized a C3+ NGL price of $34.16 per barrel.
- And . . . a pre-hedge natural gas price of $2.14 per Mcf, a $0.04 per Mcf premium to NYMEX pricing.
Management also guided the balance of the year and included a few observations. For the September quarter, they noted:
- “The industry has responded to lower commodity prices through meaningful reductions in rig and completion activity.
- Guidance of, “decreasing cash production costs by $0.05 per Mcfe to a range of $2.35 to $2.45 per Mcfe [and] decreasing realized natural gas price premium to NYMEX Henry Hub by $0.05 per Mcf . . .”
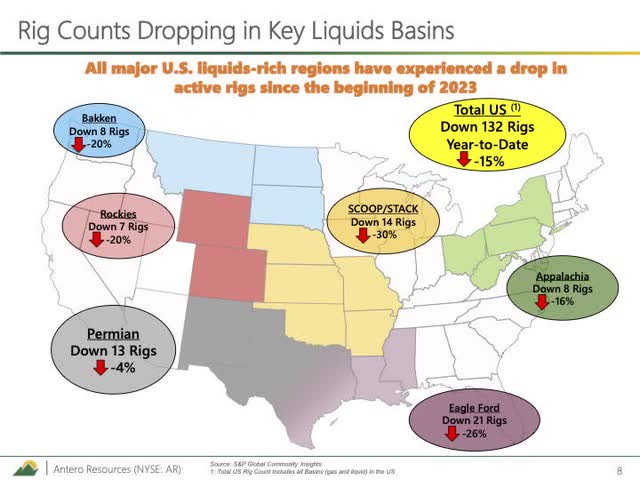
Two next slides from the presentation add detail to the lower rig count. The first summarizes the national picture.
Antero Resources 2nd Quarter
Of note, the national slow down includes significant reductions in areas producing higher levels of liquids.
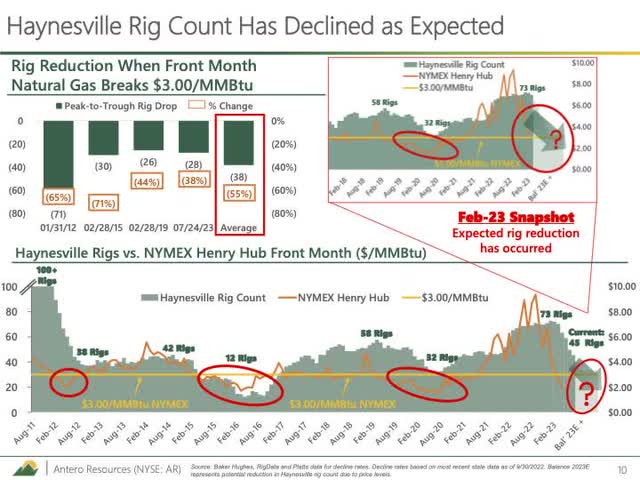
The second details Haynesville’s slowing activity, reiterating management’s prediction made a quarter ago.
Antero Resources 2nd Quarter
The information from both slides bodes well for Resources, but thus far, reductions in production are absent. In fact, our personal data for natural gas production shows a slight increase.
Note: Our NG estimate made in Antero Resources: A Tougher June Report Might Be Coming, was $2.2, versus the actual shown above at $2.14. This explains in small part the deviation from our estimate.
During the March quarter report, management noted that approximately 50% of the results for the year would come through natural gas liquids (NGL). Our estimate for the quarter of $45 was considerably higher with the actual result reported at $34.16 per barrel. With the NGL production equaling 111,000 per day, the $11 difference explains the bulk of the difference between the actual results and our estimate being $111 million. This difference leaves investors with a critical question, why didn’t the company recover 60% of the average crude oil price for the quarter? The actual capture was closer to 50%.
Estimating September
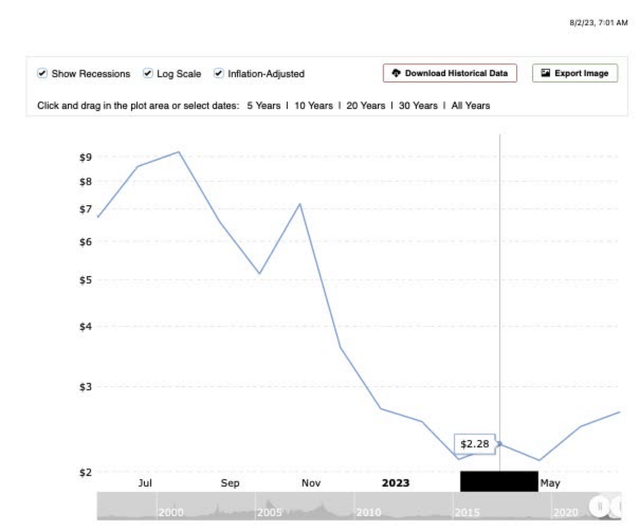
Management also included guidance lowering production costs and the Henry Hub differential by the same amount while increasing production by approximately 3%. This guidance effectively washes each other out. From the natural gas price chart shown next, July averaged higher by at least $0.30-$0.40 near $2.60.
MacroTrends
The July average trends above the guided cash cost of $2.40. With a 3% production increase, thus far the September quarter is trending considerably higher.
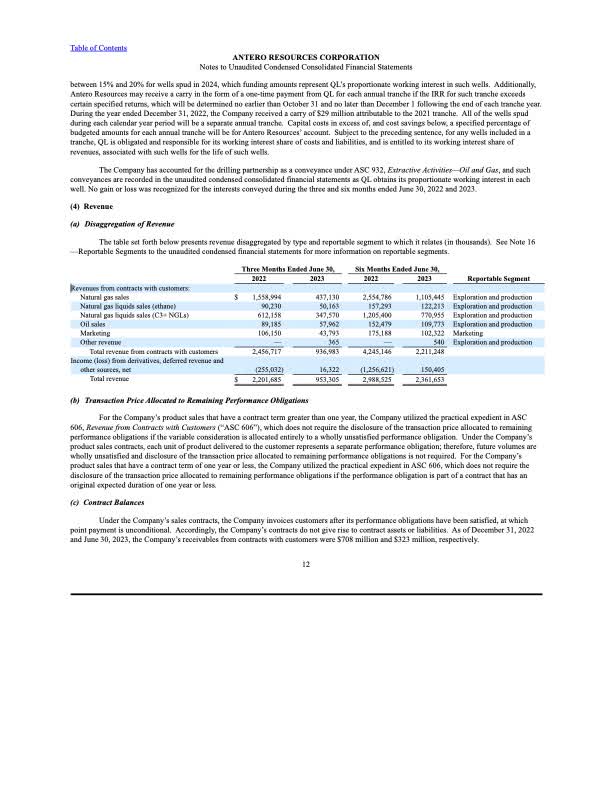
Next is a page from the last 10-Q showing revenue from NG.
Antero Resources
For the June 2023 quarter, revenue equaled $437 million while the price averaged $2.14. July’s average is the $2.60 range or a 22% increase plus 3% increase in production. Under these conditions, Antero’s revenue can be estimated at $120 million higher.
The next factor, crude oil price is also trending higher shown next.
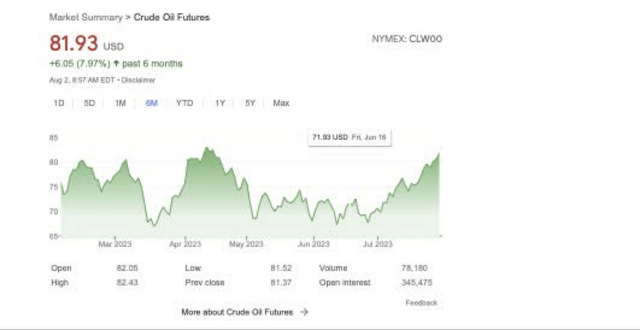
Thus far in the quarter, crude prices jumped into the low $80s and averaged near $75 for July, higher by $2-$3 from the June quarter. Estimating a 3% production increase for NGL at $8 higher, a reasonable difference for the rest of quarter, the increase in cash from liquids equals approximately $50 million (captures half of the difference).
Adding the two together, the company’s cash flow might increase by $150-$175 million. At this point in the quarter, September might generate $250-$300 million. Again, from our article, Antero Resources: A Tougher June Report Might Be Coming, referenced above,
“With interest expenses at $25 million a quarter or $75 million for a year, Antero will spend approximately $1 billion a year before it can return capital. For the 2nd quarter, I expect most of the cash to be spent on capital and interest and very little returned ($240 capital plus $25 interest).”
We expect the whole September quarter’s cash to be voluntarily consumed on capital and interest.
Results for a Full Year
The results for the whole year depend on the prices of NG and crude naturally. NG tends to increase in price in the later half during the winter. We look for the yearly results to be positive beginning in the December quarter.
What Are Risks & What Aren’t
Obviously, natural gas usage is in large part determined by weather and thus a major risk. European usage is another factor. For example, Europe imported a significantly lower level of LNG this past month. But, from our self collected NG data, the gap between usage and production has narrowed unseasonably to almost zero in the past few weeks. With the very hot weather dissipating in a large portion of the U.S., watching the deviation is an essential and productive exercise for investors. If it broadens, natural gas prices are likely to weaken.
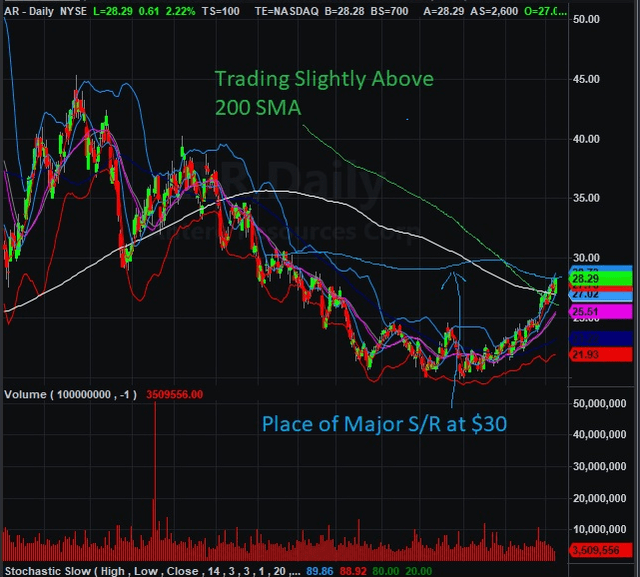
What isn’t a risk, in our view, is for Resources to head cash negative on an operational basis. The June quarter was especially weak for both oil and gas prices. The company is highly likely to generate positive cash flow. We still consider Resources a buy at prices near $25 – $30 and a hold above. A chart is included below explaining our reasoning.
TradeStation Securities
The chart reveals a strong resistance at $30 and support under $25. With NG prices still in the $2s, buying above $30 is in our view, a risk.
Read the full article here


