Welcome to another installment of our CEF Market Weekly Review, where we discuss closed-end fund (“CEF”) market activity from both the bottom-up – highlighting individual fund news and events – as well as the top-down – providing an overview of the broader market. We also try to provide some historical context as well as the relevant themes that look to be driving markets or that investors ought to be mindful of.
This update covers the period through the fourth week of October. Be sure to check out our other weekly updates covering the business development company (“BDC”) as well as the preferreds/baby bond markets for perspectives across the broader income space.
Market Action
It was another tough week for CEFs. However, unlike the previous few weeks where the weakness was driven primarily by rising long-end rates, this week’s rates actually fell but stocks kept moving lower, taking most CEF sectors along for the ride. Three CEF sectors – all of them fixed-income – eked out gains – Global Income, Taxable Munis, and Agencies.
Month-to-date, however, all sectors are firmly in the red, led by higher-beta REITs, Equity, and EM Debt sectors.
Systematic Income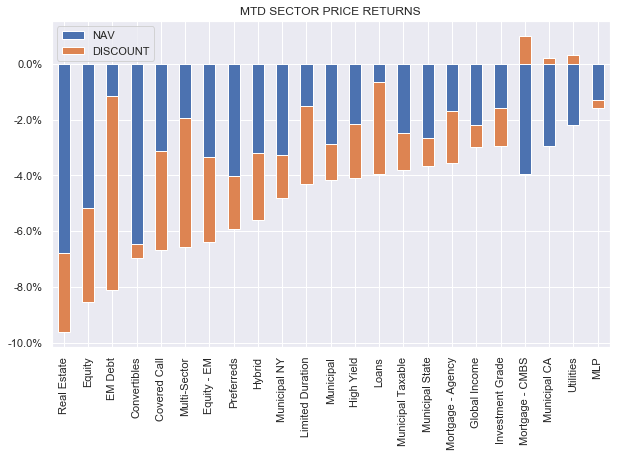
October brought the worst return for the CEF space since September of the previous year.
Systematic Income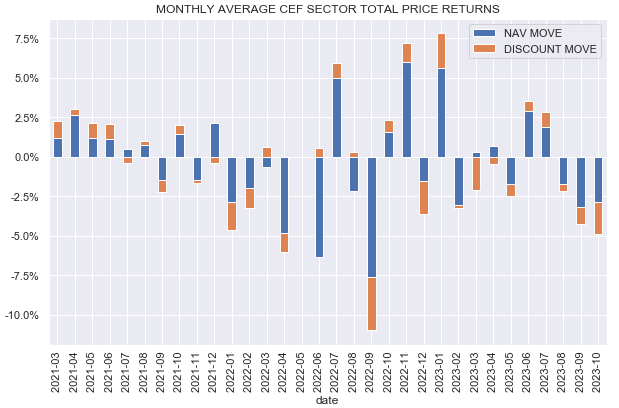
Discounts continued to push wider. Fixed-income CEF sector discounts have moved to new post-COVID wides.
Systematic Income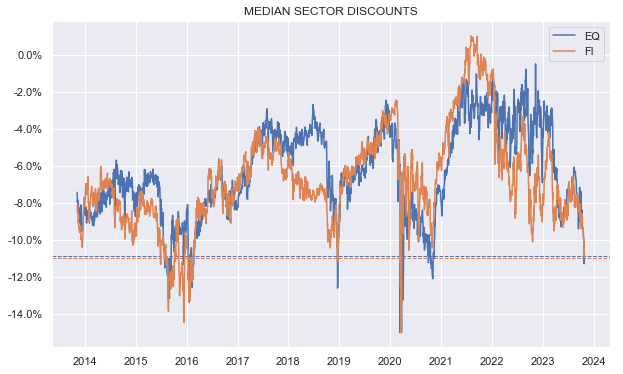
Market Themes
The average CEF discount has widened past 10% – fairly unusual territory for the space as the following (weekly) chart shows.
Systematic Income CEF Tool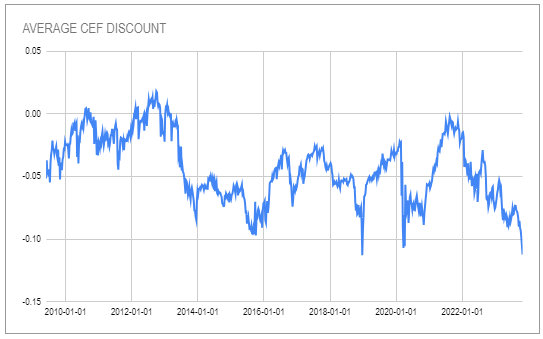
A typical pattern we tend to see during periods of discount weakness is that a lot of the weakness is led by high premium funds. In other words, higher premium funds tend to deflate more than discounted funds. We can see this in the list below where the funds that saw the largest discount widening are the high premium household names like Cornerstone Strategic Value Fund (CLM), PCM Fund (PCM), Guggenheim Strategic Opportunities Fund (GOF), and others.
Systematic Income CEF Tool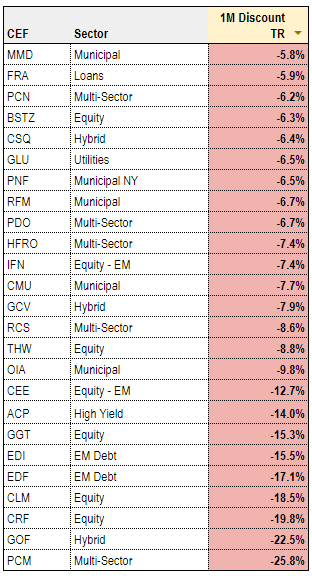
A more systematic way to look at this is to plot CEF valuations at the end of September (x-axis) and the valuation change over the past month (y-axis). We see the highest-premium funds had the largest valuation deflation and vice-versa. For example, PCM traded near a 40% premium at the end of September but had a discount widening of 26% over the past month.
Systematic Income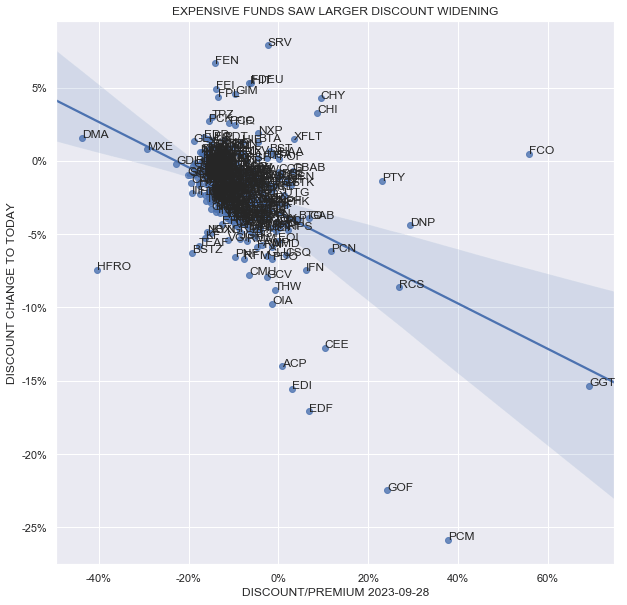
This kind of procyclical behavior is a feature of the market and one that is important to keep in mind. It can make some sense to hold high premium CEFs however these funds pose a particular danger for investors, particularly after a period of stability where investors may be lured to bid up funds that boast high yields. Though not always such premium deflations can be permanent, locking in economic losses for investors.
Market Commentary
The CMBS Invesco High Income 2023 Target Term CEF (IHIT) issued a press release that it’s nearly wound down and is sitting in cash. This suggests we shouldn’t see more NAV decay from here however the 1.2% discount is not all that tempting.
IHTA which has an expected termination date in Dec 2024 and has moved out to an 11.4% discount. If we try to disaggregate the performance of the IHIT NAV year-to-date, what we have is roughly a 5% drop due to the widening in BBB-rated CMBS spreads which means the turnover cost them an additional 13%.
This suggests that IHTA is trading at a slightly expensive level here where the discount is a bit below the potential turnover cost. Outside of this factor, this leaves a portfolio which should be yielding roughly 10-15% with some uncertainty as to the actual losses that will happen over the next year – much depends on the macro picture. Not for the faint of heart.
CEF Tool Update
This week we made a couple of updates to the SEC filing tabs of the CEF Tool. The “13F” tab shows the quarterly 13F filings which are made by institutional investors. The investors listed in the tab are those that are specifically known to be CEF investors like Saba, SIT, Bulldog as well as Rivernorth, and others.
The sorting here is by the number of investors i.e. the funds at the top have more investors holding them regardless of the number of shares. Interestingly there are a lot of Muni CEFs at the top of the list. This sector is certainly attractive from a discount perspective which is trading at a very wide level historically.
Systematic Income CEF Tool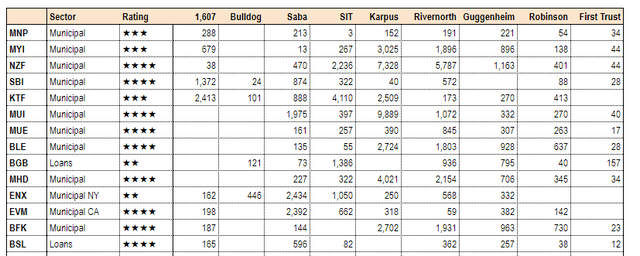
There is also the “13DG” tab which shows acquisitions of 5% or more made by investors for activist/control intent purposes (13D) or passive purposes (13G). The investors listed here are Saba, Bulldog, and Karpus. Not surprisingly all the funds here have wide discounts. Saba particularly likes BlackRock funds like BlackRock ESG Capital Allocation Term Trust (ECAT), BlackRock Capital Allocation Term Trust (BCAT), BlackRock Innovation and Growth Term Trust (BIGZ), and BlackRock Health Sciences Term Trust (BMEZ) with many millions of shares held.
Systematic Income CEF Tool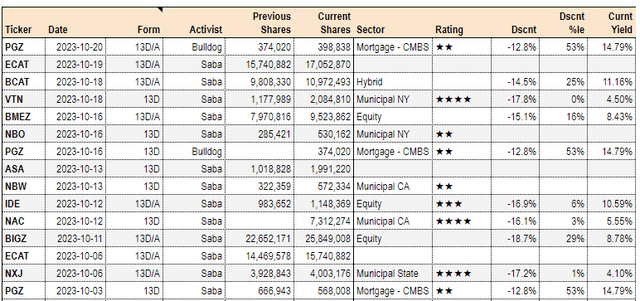
Stance And Takeaways
The CEF space remains mixed – while valuations are at very attractive levels, high leverage costs mean many fixed-income funds struggle to generate much net income on their leveraged assets. The recent yield curve disinversion has certainly helped and this remains a key area to watch.
We continue to like funds like the term preferred CEF Nuveen Preferred & Income Term Fund (JPI), PIMCO Energy & Tactical Credit CEF (NRGX), and the newly launched CLO Equity CEF Carlyle Credit Income Fund (CCIF) which offer a combination of attractive valuation and tactical upside.
Read the full article here


