We believe conventional investment strategies are poised to undergo a significant restructuring, placing a prominent emphasis on investments in hard assets. As illustrated in the accompanying chart, the valuation history of 60/40 portfolios unfolds through extended cycles, and we are currently experiencing another critical juncture in this dynamic.
In August 2021, the combined valuation of overall equities and US Treasuries had reached its most expensive level in 130 years. To put the current valuation imbalance into perspective, its recent peak was a staggering 61% higher than its previous peak in the early 2000s. Although prices have corrected somewhat, particularly in the Treasury market, today’s elevated multiples still bear resemblance to periods that preceded significant economic downturns, such as the Great Depression of 1929 and the Tech Bust of 2001.
The rise in popularity and the success of these traditional investment strategies in recent decades can be credited to a period characterized by disinflation, fostering one of the most speculative environments in the history of financial markets. It is highly unlikely that equities and bonds, given their current inflated prices, will together yield substantial returns over the next decade. This is particularly the case in a world where structural inflationary forces continue to evolve in the system, while the cost of capital is expected to exceed historical norms.

Treasuries: No Longer the Safest Alternative
The shifting dynamics of capital moving away from crowded equity and fixed-income holdings, as investors seek new investment opportunities, could have profound implications in financial markets. This is where gold and overall commodities are poised to play a significant role during this transitional phase.
As is widely recognized, the 40% segment of these conventional portfolios, mainly comprised of fixed-income assets, has been facing substantial challenges. This has led to fundamental questions about the potential need to restructure these allocations. The main reason why investors include this portion in their portfolios is primarily because they are in search of safe-haven assets with minimal downside volatility, especially those that tend to perform well during economic downturns. Nevertheless, institutions should deeply reflect upon this crucial analysis:
For the first time in 45 years, US Treasuries have exhibited higher downside volatility than gold.
It’s noteworthy that global central banks have already begun to accumulate gold for their own reasons. This effort is essential in order to elevate the standard of quality for their international reserves after enduring an extended period of imprudent monetary policy decisions. Rather than loading their balance sheets with debt instruments from another economy that is already burdened by a history of indebtedness, it is imperative for global central banks to hold a neutral alternative with centuries of proven credibility as a hard asset to become the cornerstone of their monetary systems.
We anticipate that these policy changes will exert significant influence on other major institutions, which are likely to gradually adopt gold as a haven alternative over time.

The Neglected Essential Part of Our Economy
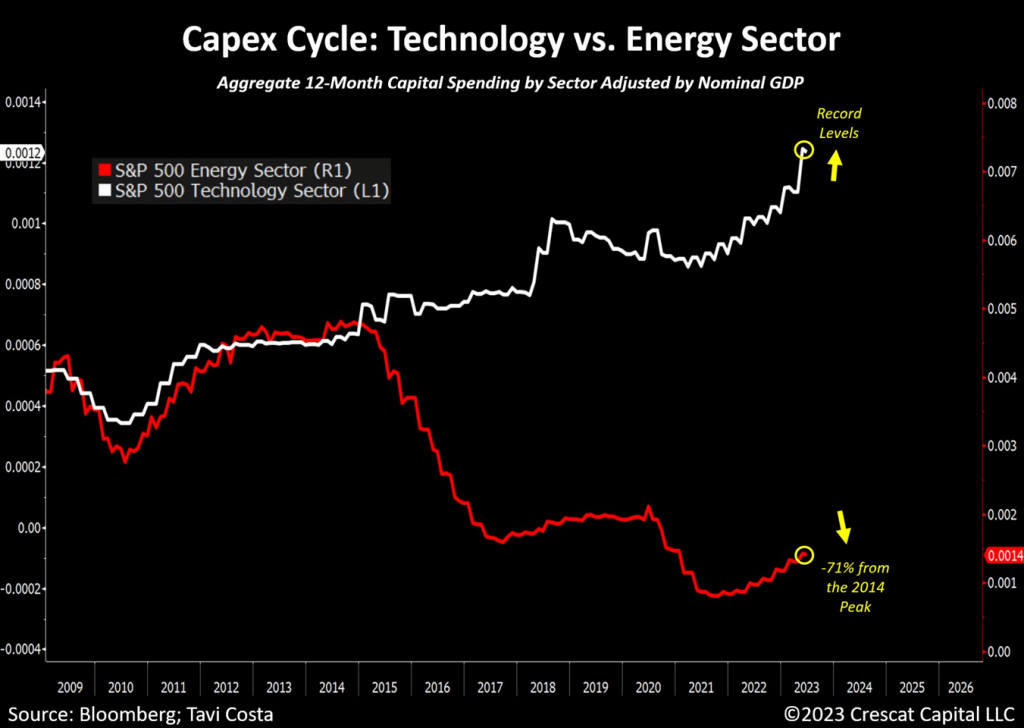
Another reason why inflationary forces persist so prominently today can be attributed to the striking disparity in capital allocation between technology and resource industries, a problem that remains historically notable. This is indeed a concerning matter, emphasizing the prevailing investor concentration on one sector of the market, often at the expense of businesses that remain fundamental to our economy today.
It’s crucial to remember that resource industries necessitate sustained, substantial capital investment to ramp up production ahead of a period of growing demand. But capital markets are often not in sync. This is why we have business cycles and the primary reason why commodity bull markets tend to begin with sharp price increases due to supply shocks. Moreover, when a sector-wide lack of investment has occurred over a long period of time, commodity bull cycles are also likely to play out over extended trends.
The rise of deglobalization and challenges in housing affordability are likely to further drive the need for infrastructure development, ultimately creating upward pressure on the demand for materials and natural resources to meet these evolving requirements.
Japan: A Compelling Case Study
It can be challenging for most people to grasp the idea of hard assets becoming a reliable alternative to traditional portfolios, especially when looking at their underperformance during the Global Financial Crisis in contrast to the strong performance of US Treasuries. To fully comprehend this concept, one needs a deeper understanding of historical patterns, acknowledging that different asset correlations emerge during inflationary periods.
Developed economies are currently facing a chronic debt crisis, with deeply entrenched inflationary pressures propelled by escalating deglobalization, reckless fiscal spending, worsening inequality, and limited access to essential natural resources.
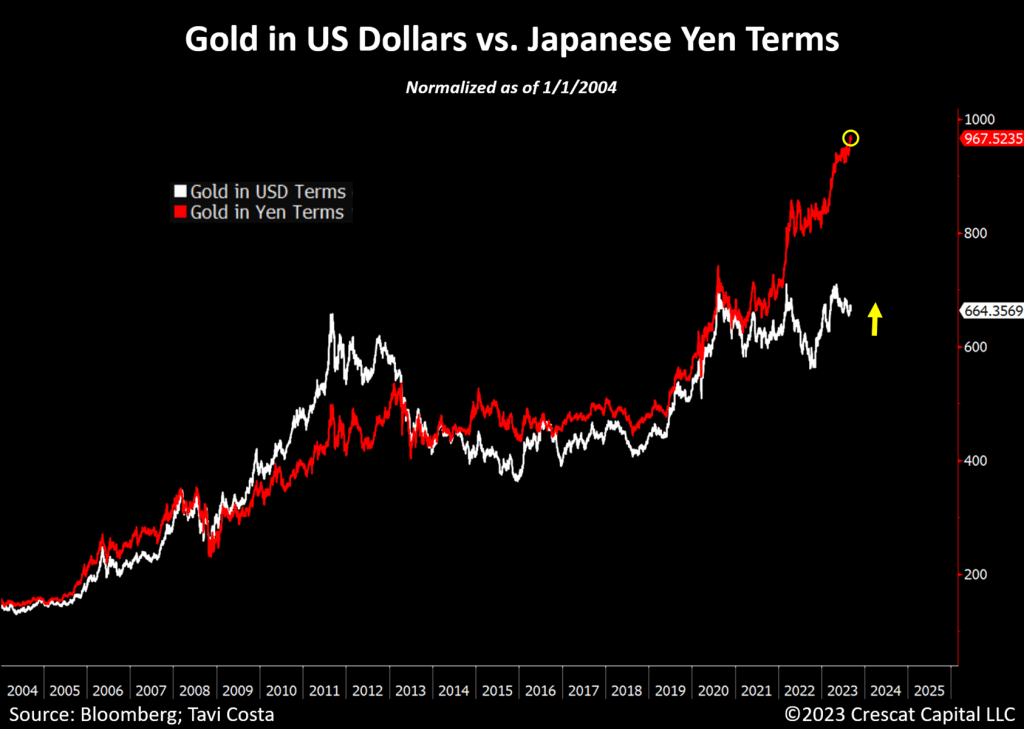
The Japanese economy is a compelling case study of a country that has suffered from a prolonged period of monetary and fiscal indiscipline. The fact that the Bank of Japan has made repeated attempts to alleviate the mounting cost of debt, even with 10-year interest rates at a mere 0.7%, arguably stands as one of the most significant macro events in recent times and is a roadmap for the broader global economy. Their economy’s reliance on continuous government intervention vividly underscores the magnitude of the present debt crisis. It is no surprise that gold prices in Japanese Yen terms persistently reach record levels.
Make no mistake; this situation is not exclusive to Japan. The Fed, the European Central Bank, the Bank of England, the People’s Bank of China, and others are on the brink of confronting the very same predicament.
In a world burdened by historical levels of debt, it’s important to remember that over time, all paper currencies should lose value against hard assets. In our strong view, the yen is just an early mover.
Introducing Hard Assets to 60/40 Portfolios
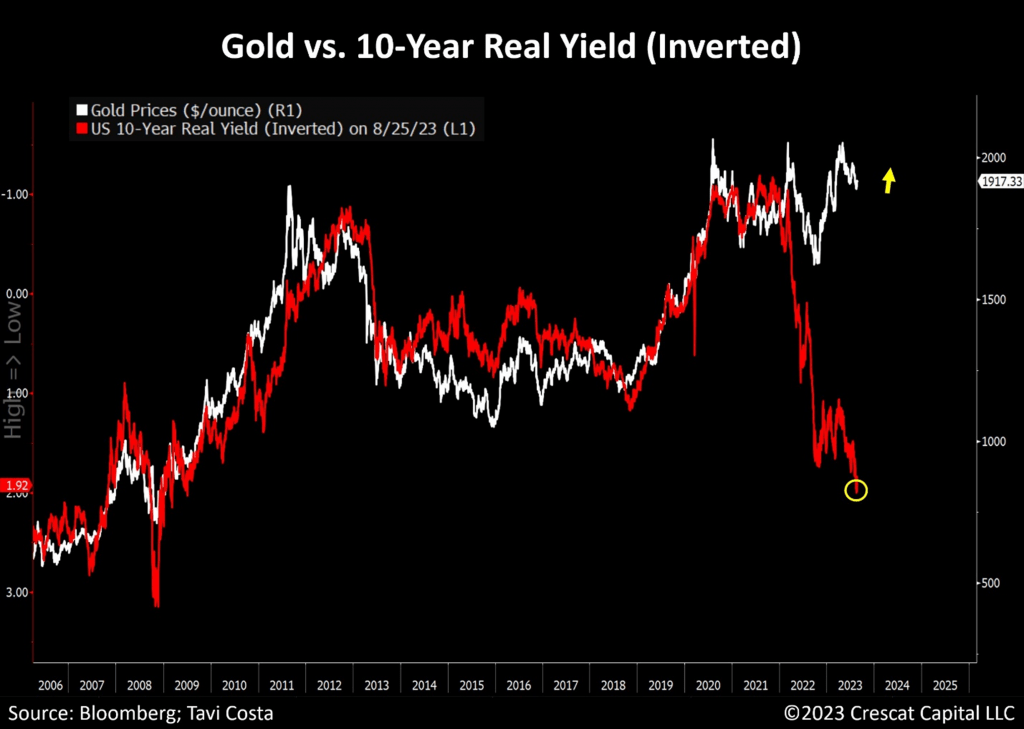
Another popular argument against the idea of investing in tangible assets in today’s economic environment, particularly gold, is the challenge posed by rising interest rates, as it may seem less attractive to hold an asset that doesn’t yield anything. However, historical examples contradict this notion. Gold delivered some of its strongest performances during the 1970s, despite the backdrop of increasing interest rates.
This trend isn’t limited to that specific decade; you can find similar instances in the 1910s and 1940s. While gold prices may not have been freely floating during those periods, other tangible assets, such as commodities, demonstrated remarkable performance.
There is a clear and compelling reason why the current price of gold remains impressively resilient despite the pressure from real rates. The weakening of the correlation between inflation-adjusted yields and precious metals is becoming more apparent. With inflation running hotter than historical standards, gold is highly likely to decouple from Treasury prices, much like it did during the 1970s.
Who would have thought that in such an intricate macro environment, there would be so many skeptics about owning hard assets?
Further Debt Growth Likely Ahead
If we consider Japan’s government debt imbalance as a leading indicator, it suggests that other global economies might not have fully realized the extent of their leverage issues. While the US federal debt currently stands at over 120% of nominal GDP, Japan’s figure is more than double that amount, now at 255%!
Similar to the steps taken by the Bank of Japan, even in the face of prevailing inflationary pressures, central banks in heavily indebted economies inevitably find themselves compelled to become the primary purchasers of their own government debt.
The current monetary policy in the US is starkly misaligned with the surge in Treasury issuances and the prevailing levels of fiscal irresponsibility.
It’s important to note that the Fed’s ownership of US federal debt has recently plunged to 2014 levels. Inevitably, this trend needs to be reversed.

Today’s Fiscal Spending Is Indeed Highly Inflationary
Many recent articles have suggested that the current fiscal spending may not be stimulative in the traditional sense, as a substantial portion of it is driven by the sharp rise in interest payments. However, it’s important to note that this perspective is not entirely accurate.
Even without factoring in the cost of servicing the debt, fiscal spending alone represents over 25% of GDP in the US. Today’s government expenditure has already surpassed the levels seen after the Global Financial Crisis. The notable distinction is that we haven’t experienced an economic downturn yet.
What’s even more important, apart from the Covid recession, we have not witnessed such a substantial scale of government stimulus in the past half-century. The lack of fiscal discipline is likely to persist as a prominent driver of inflation.

The Resurgence of Labor Market Participation
The former member of the Federal Reserve Board of Governors Lael Brainard, who now serves as the director of the National Economic Council, recently had an interview on CNBC where she shared her assessment of the recent rise in labor force participation. She expressed optimism about the increasing numbers, attributing them to a strong economy and the availability of what she referred to as “really terrific” job opportunities.
Our assessment, however, takes a completely different perspective.
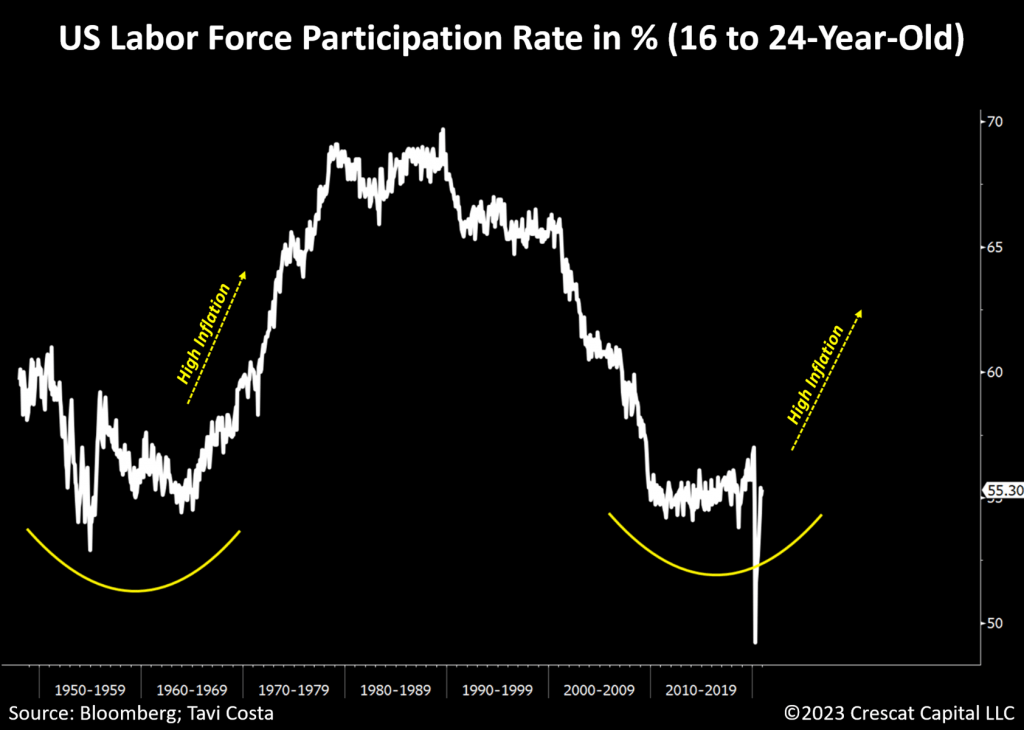
When we examine historical trends, the resurgence of labor market participation is yet another indicator of potential inflationary problems in the system. A similar pattern occurred back in the 1970s when rising living costs compelled households to rejoin the labor market. The term “The Great Resignation,” frequently highlighted by the media, is fundamentally rooted in looking at the past.
We believe the labor force participation rate is likely in the process of bottoming. While some policymakers may interpret this as a positive development, we see it as further evidence that we could be entering a period characterized by stagflation.
This trend is evident across all age groups, but it is particularly noticeable among individuals aged 16 to 24. Younger individuals have significantly reduced their participation in the labor market since the peak of inflation in the early 1980s. As long as inflation remains higher than historical norms, this demographic, along with others, is likely to become a substantial addition to the job market.
Wealth Gap Issues Lead to Further Government Spending
A notable contrast to the inflationary period of the 1970s is the prominence of today’s inequality problem.
Different from the broad wage-price spiral experienced back then, the convergence of the current wealth gap disparity and a substantially elevated cost of living is set to concentrate growing wage pressure among the broad population in the lower and middle-income groups.
This situation mirrors what is often witnessed in emerging markets. To confront these challenges, governments tend to prioritize extensive fiscal stimulus measures aimed directly at addressing populist social welfare issues, thereby exacerbating of the inflationary problem.
Developed economies are starting to adopt similar social policies, although these trends are still in their early phases. This is expected to contribute significantly to increased government spending as time progresses.

The Proliferation of Labor Strikes
The growing wage pressure is becoming more apparent, leading to a more frequent occurrence of labor strikes in society. This situation is reminiscent of historical periods when consumer prices also exceeded historical norms, serving as unmistakable signs of an inflationary setting.
This is an interesting chart showing that Google trends for the word “strike” recently surged to record levels. This spike implies a growing pressure among workers to secure improved compensation deals with their employers.

Wage Pressure on a Global Scale
However, today’s wage-price spiral appears to be a global phenomenon. Developed economies have not dealt with these types of structural inflationary forces for many decades, and consequently, there continues to be a prevalent issue of excessive government spending. This reflects the lack of understanding among policymakers about how fiscal stimulus tends to have highly inflationary effects.
To draw from the example of Japan once again, its economy is currently undergoing a fundamental shift at its core. Following a period of more than 30 years with muted wage growth, Japanese workers have finally started demanding higher salaries.
The chart below is courtesy of our friends at Donald Smith & Co.

Diverging Against the Consensus Narrative
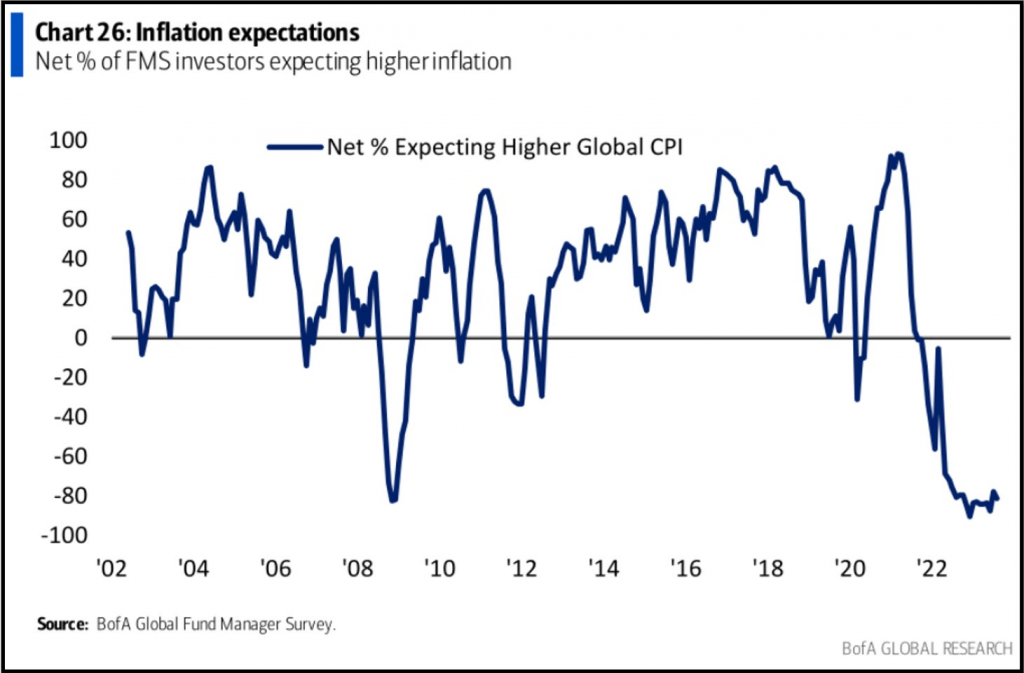
Meanwhile, investors expecting global inflation to decelerate is the most consensus view in the history of the data, even lower than during the Global Financial Crisis.
This is consistent with how market participants are the most bullish on long-term Treasuries they have ever been, as indicated by the BofA Global Fund Manager Survey. Crowded market views are often wrong, the current inflationary forces appear to have a significant underlying structural foundation.
Inflation Develops Through Waves
Market participants and the Federal Reserve seem to be committing a significant oversight by neglecting past experiences and patterns.
While the macro environment today differs from that of the 1970s or 1940s, a lesson from history remains: inflation tends to develop through waves.
Despite all the debate regarding the 1940s and 1970s:
Inflation turned out to be structural in nature and manifested itself through waves during both periods.
Take note of that in perspective of what is unfolding today. Inflation is likely in a bottoming process, and the recent developments in commodity prices and breakeven rates are adding to that case.
This is not a cyclical issue; instead, the main drivers of today’s inflationary regime are:
- Deglobalization,
- Irresponsible levels of government spending,
- Ongoing commodity supply constraints,
- Wage-price spiral, especially among lower-income workers.


Unpopular Opinion: This Is Not 2008
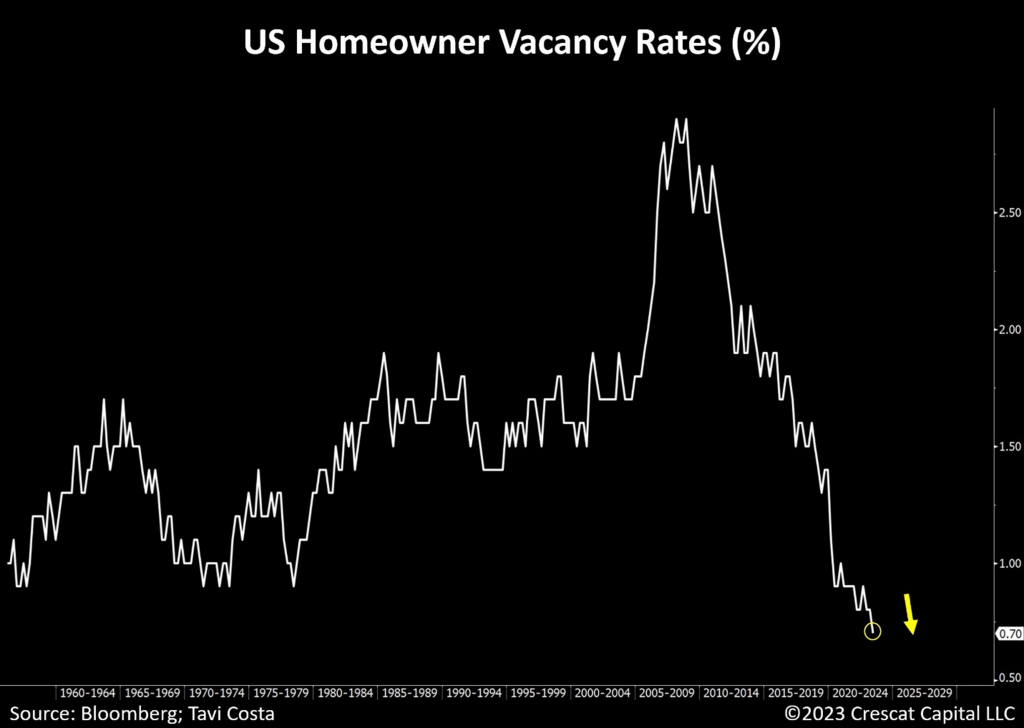
The housing market is progressively emerging as a more significant contributor to the inflation issue.
The US now has the lowest vacancy rates in almost 70 years. Contrary to what most believe, the current scenario does not appear to be a repeat of the housing bubble. There is no oversupply of residential real estate inventory.
Although there might be some healthy short-term price adjustments due to higher mortgage rates, the housing market should continue to contribute to the inflationary pressure over the long term.
The solution to this problem is to build more homes. There is a reason for Warren Buffett’s substantial increase in investments among US homebuilders.
Nevertheless, let us not forget that expanding the overall house supply entails a significant demand for materials and various commodities as well. Here we come full circle for another important reason to own hard assets in this environment.
Housing Prices Making New Highs
Looking at the recent sales transactions, house prices have accelerated significantly in the last 4 months to record levels, now growing at almost a 10% annualized rate.

Twin Deficits Gradually Worsening
To further emphasize the importance of owning commodities in today’s environment. The US is now running twin deficits that are as severe as those experienced during the worst parts of the Global Financial Crisis. This factor has contributed to the recent weakness in the US dollar.
Of even greater concern is the indication that this represents an ongoing structural issue that is still in the process of evolving. Note that with each prior recession, this measurement has reached new lows.

A New Gold Cycle
The multitude of macro drivers supporting the onset of another gold cycle is truly remarkable. Amplified by the prevailing skepticism surrounding the metal, we are arguably experiencing the most important time in gold’s history.
The stars are aligning, and it appears to be only a matter of time until we see a major breakout from the recent triple-top formation.

Silver: Poised for an Explosive Move
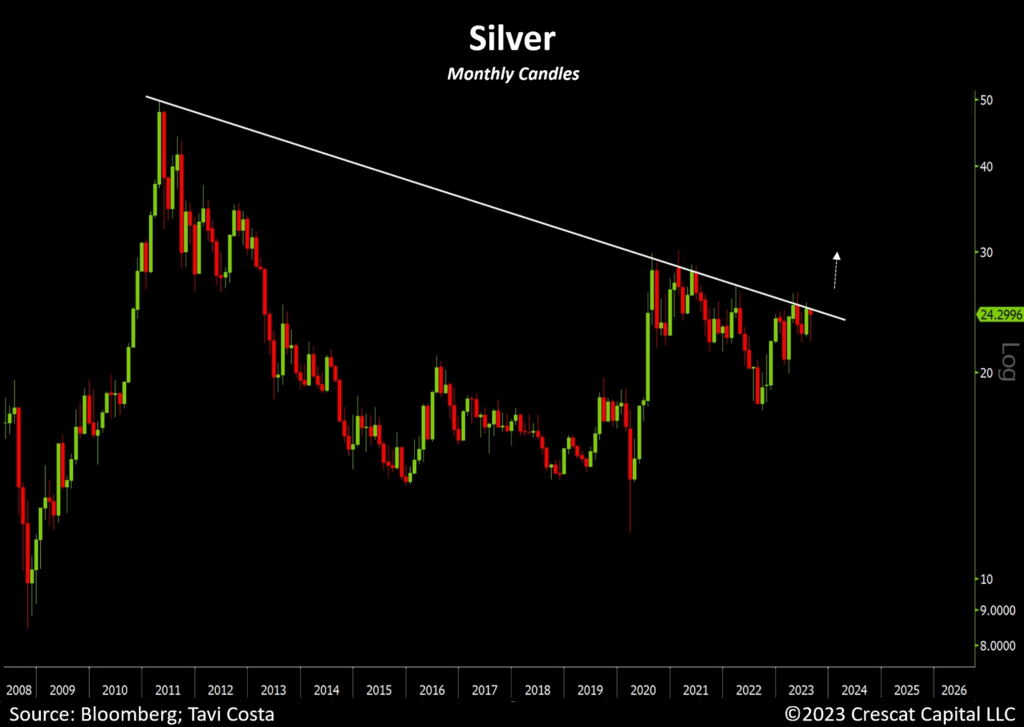
The chart below is possibly the most important technical chart for precious metals investors today. Silver is incredibly close to a major breakout from a 12-year resistance. Following an extended period of consolidation, the metal is poised for a vigorous rally to revisit its highs from 2011. At its current price, silver appears to be exceptionally attractive and is likely to take the lead in this long-term cycle.
Climbing A Wall of Worry
Palladium futures now have the largest net speculative short position on record. Overall precious metals look incredibly attractive after the surge in prices from oversold levels.
Amidst the prevailing overwhelmingly negative sentiment, gold appears to be gearing up for a historical breakout from a triple-top technical formation. Major capital allocators are only starting to realize that traditional 60/40 portfolios are no longer the optimal positioning for navigating today’s inflationary regime.

Multiple Compression During Inflationary Decades
Inflation is indeed a critical piece of the current macro puzzle. When consumer prices experience upward pressure, it triggers a cascade of effects:
Interest rate risks increase, the cost of capital spikes, the likelihood of defaults by businesses and governments rises, the cost of living becomes more expensive, workers demand higher wages, business profit margins are squeezed, and ultimately, corporate earnings contract as a result.
This dynamic is what causes stagflation.
Meanwhile, investors have been conditioned to value financial assets as if they were about to experience another disinflationary decade with high growth.
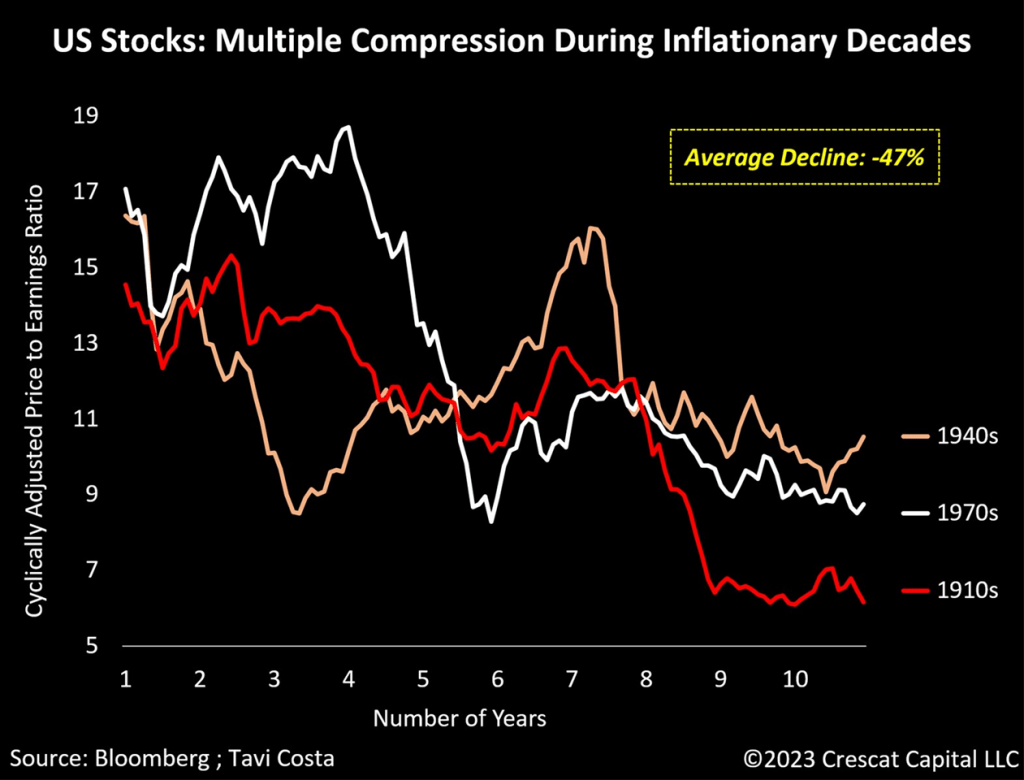
As shown in the last chart, the last time we had a long period of higher-than-average cost of capital was in the 1910s, 1940s, and 1970s. While each had its own unique circumstances, fundamental multiples for stocks significantly contracted over all those decades. To be specific, the average decline was nearly 50%.
More importantly, note that CAPE ratios were at single digits at the end of two periods, and around 10.5x for the ’40s.
What if today’s multiples were to reach similar levels by the end of this decade?
Today’s Inflated Multiples Echo October 1929
The overall equity market valuations remain at an extraordinarily high level. After re-testing the peak tech bubble levels on a 5-year cyclically adjusted P/E ratio basis, stocks are still more overvalued than they were before the Great Depression in October 1929.
The cost of debt is on the rise, and justifying today’s fundamental multiples is becoming increasingly challenging.
On a separate note, it’s astonishing to hear people draw comparisons between the current economic environment and the prosperous period of the 1920s. Back then, the 5-year CAPE ratio was less than 5, or the lowest level in history. Today’s situation is markedly different.

Both Issues at Once: Inflation & Valuation
Let us not forget that since 1900, there have been five decades that the total return for stocks was negative. Returns during each of these periods were in fact deeply negative. Three of them happened during the inflationary eras. The other two occurred when equity valuations were at historical levels. Today, like never before, we have both setups at the same time.

The Heightening Likelihood of a Hard Landing
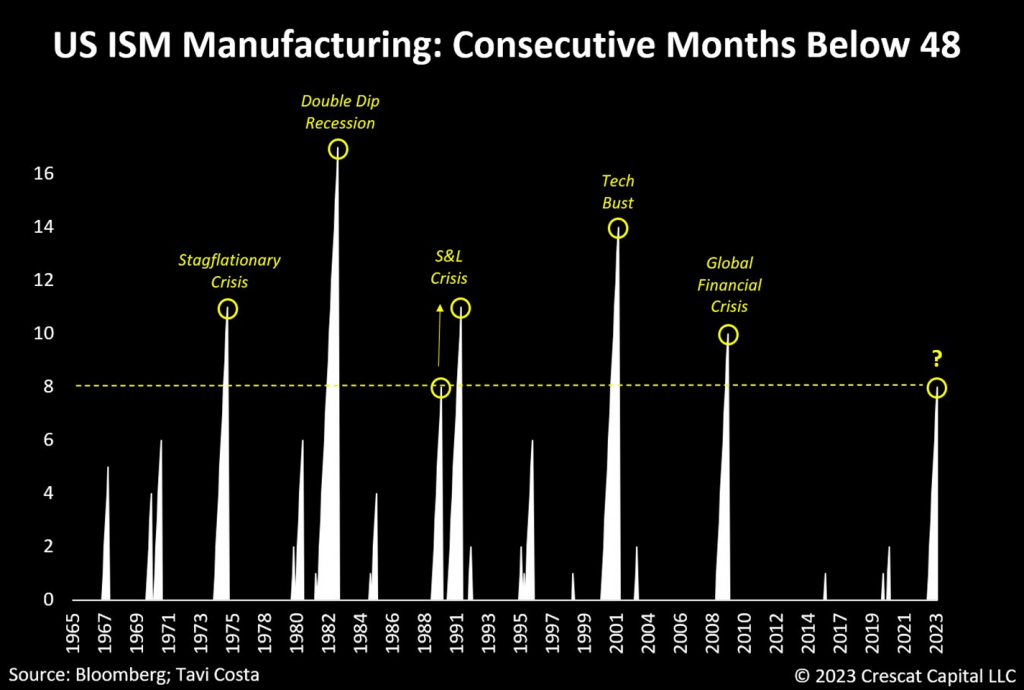
The ISM manufacturing index has been below the 48 level for eight consecutive months, a pattern that has only occurred during all previous hard landings in the last 55 years. While investors often have short memories, there is substantial evidence pointing towards a possible repetition of this trend:
- Severe yield curve inversions,
- The potential lagging effect of the steepest monetary tightening in decades,
- The narrow leadership in the stock market,
- A significant rise in the cost of debt,
- Oil prices nearing $90 per barrel,
- Contracting corporate fundamentals.
In the meantime, financial markets remain excessively complacent, with credit spreads at historically low levels and exorbitantly high valuations in the overall stock market.
Signs of Credit Tightness
We are now seeing the widest spread between mortgage rates and 30-year risk-free rates in history. The last times we experienced cyclically large spreads were ahead of the tech bust, in the midst of the global financial crisis, and during the pandemic recession. This indicator shows that credit has already tightened substantially in the housing sector though credit spreads have yet to follow in a similar way in the corporate debt market and thus the economy is not in recession just yet. Nonetheless, the record spike in mortgage spreads appears to be an even stronger warning shot than the one ahead of the tech bust and 2001 recession.

The Financial Pinch on Consumers
The tightening of financial conditions is well illustrated in this chart. US housing payment for new homes is now as high as 51% of the median household income. That is the highest level since the 1980s.

An Important Market Divergence
10-year Treasury prices are decisively breaking below the levels that triggered the recent banking issues. The inflated valuation of financial assets hinges on a low cost-of-capital environment, a circumstance that no longer holds true today.
Investors are starting to grasp the significance of structurally elevated discount rates but there is a long way to rectify these deeply ingrained valuation imbalances.

The First Dominos to Fall
Most fund managers have been expecting long-term interest rates to fall, but the 10-year yield is now surpassing its previous peak from last year, reaching its highest point in 16 years.
The Treasury and mortgage markets have been to be the first dominos to fall given this dynamic. It is hard to believe the stress in these markets won’t trigger further problems in the banking sector that lead to rising corporate credit spreads and overall market volatility, both of which remain historically suppressed.
Note the resurgence of the growth to value rotation unfolding again today. At the same time, cracks in the junk bond market are just starting to appear with further downside likely ahead.

Stairs Up, Elevator Down
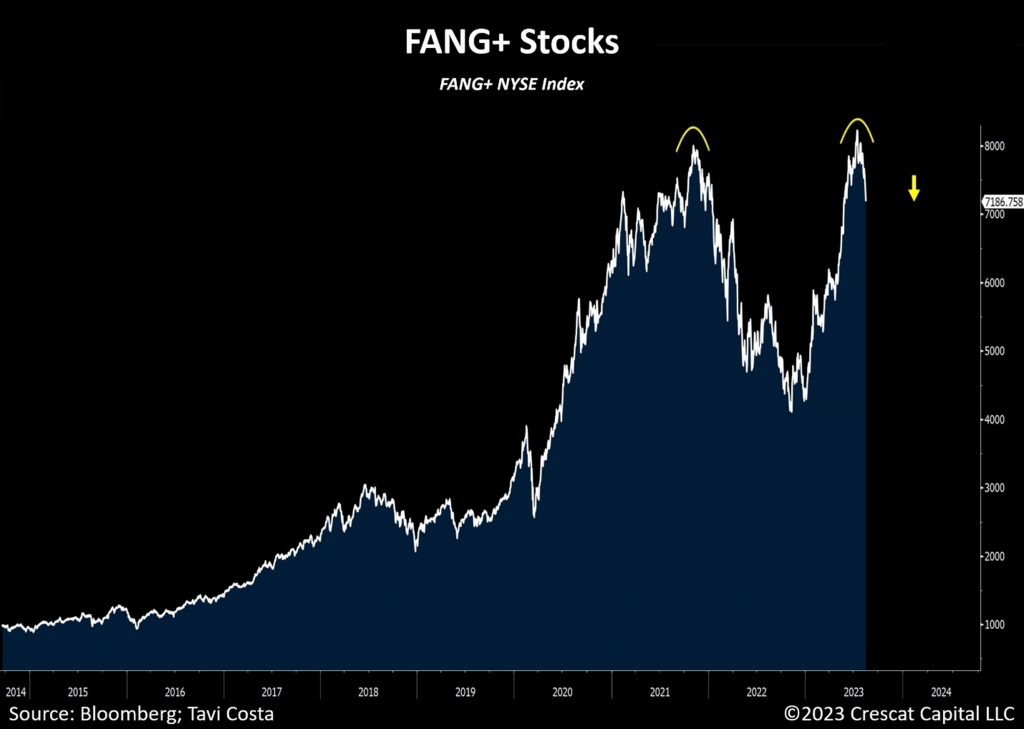
The double-top formation on the FANG+ index has become more evident. As of today, the aggregate P/E for these companies is approximately 45x, or 29x the estimated earnings for next year. Similar to how mega-cap tech stocks drove the market higher, these stocks are now the first ones to come under pressure.
Ultimately, fundamentals matter, particularly at a time when the cost of capital is higher than historical standards.
Speculative Bubbles Abound
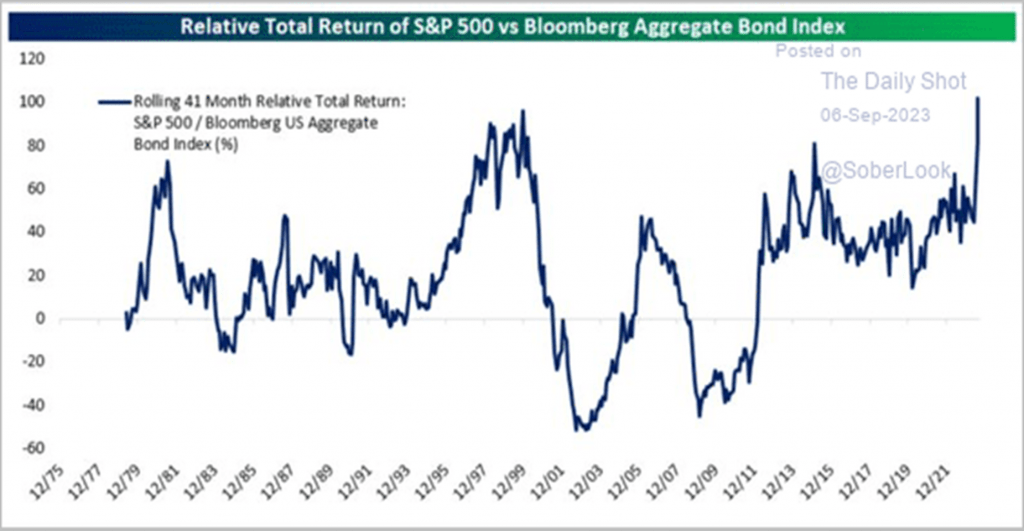
Equity markets appear to be stretched, even when compared to the bond market, which is facing its own set of problems. The relative performance of the S&P 500 versus US Treasuries is as extreme as it was during the peak of the tech bubble.
Overvaluation in both stocks and bonds is at the core of the issues surrounding the overly popular 60/40 portfolios, contributing to the inflated-price imbalance of these assets.
Over the next few years, we expect conventional investment portfolios to undergo a notable shift towards greater balance, with a new emphasis on allocating to commodities.
Throughout history, the relentless surge in energy prices has consistently played a pivotal role in triggering economic downturns. One could argue that the current structural and political factors are even more compelling than those observed in past cycles.
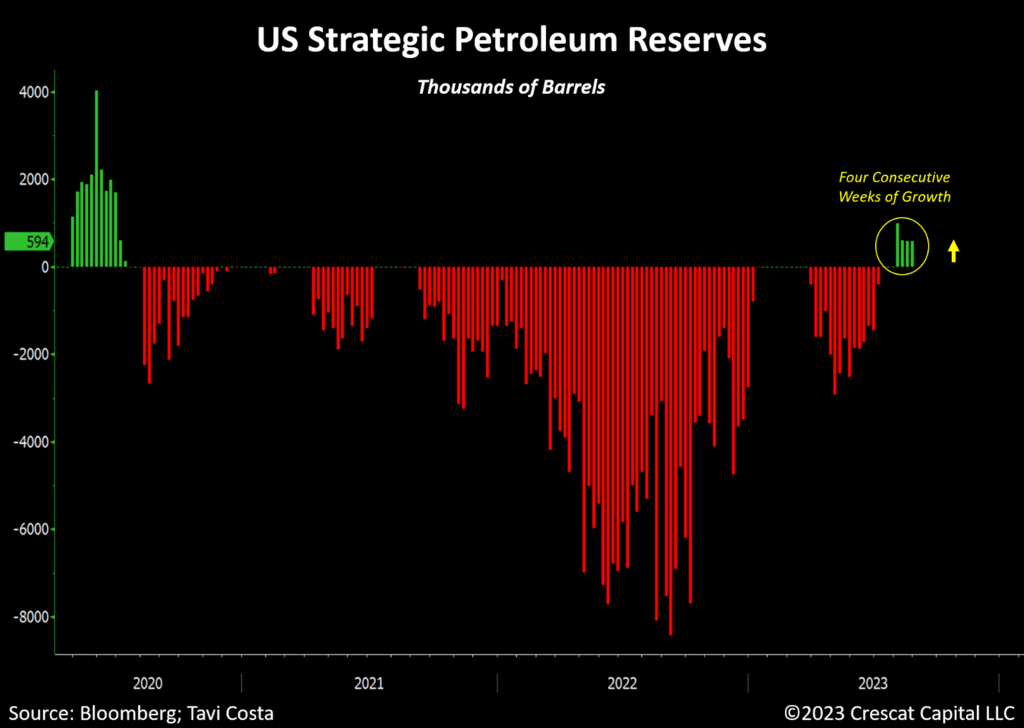
The recent surge in oil prices above $85 per barrel coincided with 4 consecutive weeks of growth in the US Strategic Petroleum Reserves. This is the largest sequence of weekly increases since the pandemic recession. Energy prices have been steadily rising with implied demand for oil near all-time highs while gasoline prices are at the highest level in almost a year.
Additionally, US oil production has not yet returned to pre-pandemic levels, and aggregate capital spending for energy companies remains 52% below the 2014 peak.
Inflationary forces remain entrenched in the economy and the government is now having to walk back its erratic policy of depleting its Strategic Petroleum Reserves at an extremely sensitive juncture.
Oil prices are likely to face further upward pressure due to persistently tight supply conditions. As a result, energy equities are already approaching new recent highs. If that serves as a roadmap, WTI prices have a 45% appreciation potential ahead to get back to their own recent highs.
A continued resurgence in the price of crude and its refined products is a crucial aspect of the current macro puzzle because it could lead to an imminent second wave of rising inflation. In that case, masses of investors currently reveling in the disinflationary soft landing thesis would likely be caught off-guard.

Kevin C. Smith, CFA, Founding Member & Chief Investment Officer
Tavi Costa, Member & Macro Strategist
|
© 2023 Crescat Capital LLC Important Disclosures Performance data represents past performance, and past performance does not guarantee future results. An individual investor’s results may vary due to the timing of capital transactions. Performance for all strategies is expressed in U.S. dollars. Cash returns are included in the total account and are not detailed separately. Investment results shown are for taxable and tax-exempt clients and include the reinvestment of dividends, interest, capital gains, and other earnings. Any possible tax liabilities incurred by the taxable accounts have not been reflected in the net performance. Performance is compared to an index, however, the volatility of an index varies greatly and investments cannot be made directly in an index. Market conditions vary from year to year and can result in a decline in market value due to material market or economic conditions. There should be no expectation that any strategy will be profitable or provide a specified return. Case studies are included for informational purposes only and are provided as a general overview of our general investment process, and not as indicative of any investment experience. There is no guarantee that the case studies discussed here are completely representative of our strategies or of the entirety of our investments, and we reserve the right to use or modify some or all of the methodologies mentioned herein. This presentation is not an offer to sell securities of any investment fund or a solicitation of offers to buy any such securities. Securities of a fund managed by Crescat may be offered to selected qualified investors only by means of a complete offering memorandum and related subscription materials which contain significant additional information about the terms of an investment in the Fund and which supersedes information herein in its entirety. Any decision to invest must be based solely upon the information set forth in the Offering Documents, regardless of any information investors may have been otherwise furnished, and should be made after reviewing such Offering Documents, conducting such investigations as the investor deems necessary and consulting the investor’s own investment, legal, accounting and tax advisors in order to make an independent determination of the suitability and consequences of an investment in the Fund. Risks of Investment Securities: Diversity in holdings is an important aspect of risk management, and CPM works to maintain a variety of themes and equity types to capitalize on trends and abate risk. CPM invests in a wide range of securities depending on its strategies, as described above, including but not limited to long equities, short equities, mutual funds, ETFs, commodities, commodity futures contracts, currency futures contracts, fixed income futures contracts, private placements, precious metals, and options on equities, bonds and futures contracts. The investment portfolios advised or sub-advised by CPM are not guaranteed by any agency or program of the U.S. or any foreign government or by any other person or entity. The types of securities CPM buys and sells for clients could lose money over any timeframe. CPM’s investment strategies are intended primarily for long-term investors who hold their investments for substantial periods of time. Prospective clients and investors should consider their investment goals, time horizon, and risk tolerance before investing in CPM’s strategies and should not rely on CPM’s strategies as a complete investment program for all of their investable assets. Of note, in cases where CPM pursues an activist investment strategy by way of control or ownership, there may be additional restrictions on resale including, for example, volume limitations on shares sold. When CPM’s private investment funds or SMA strategies invest in the precious metals mining industry, there are particular risks related to changes in the price of gold, silver and platinum group metals. In addition, changing inflation expectations, currency fluctuations, speculation, and industrial, government and global consumer demand; disruptions in the supply chain; rising product and regulatory compliance costs; adverse effects from government and environmental regulation; world events and economic conditions; market, economic and political risks of the countries where precious metals companies are located or do business; thin capitalization and limited product lines, markets, financial resources or personnel; and the possible illiquidity of certain of the securities; each may adversely affect companies engaged in precious metals mining related businesses. Depending on market conditions, precious metals mining companies may dramatically outperform or underperform more traditional equity investments. In addition, as many of CPM’s positions in the precious metals mining industry are made through offshore private placements in reliance on exemption from SEC registration, there may be U.S. and foreign resale restrictions applicable to such securities, including but not limited to, minimum holding periods, which can result in discounts being applied to the valuation of such securities. In addition, the fair value of CPM’s positions in private placements cannot always be determined using readily observable inputs such as market prices, and therefore may require the use of unobservable inputs which can pose unique valuation risks. Furthermore, CPM’s private investment funds and SMA strategies may invest in stocks of companies with smaller market capitalizations. Small- and medium-capitalization companies may be of a less seasoned nature or have securities that may be traded in the over-the-counter market. These “secondary” securities 12 often involve significantly greater risks than the securities of larger, better-known companies. In addition to being subject to the general market risk that stock prices may decline over short or even extended periods, such companies may not be well-known to the investing public, may not have significant institutional ownership and may have cyclical, static or only moderate growth prospects. Additionally, stocks of such companies may be more volatile in price and have lower trading volumes than larger capitalized companies, which results in greater sensitivity of the market price to individual transactions. CPM has broad discretion to alter any of the SMA or private investment fund’s investment strategies without prior approval by, or notice to, CPM clients or fund investors, provided such changes are not material. Benchmarks HFRX GLOBAL HEDGE FUND INDEX. The HFRX Global Hedge Fund Index represents a broad universe of hedge funds with the capability to trade a range of asset classes and investment strategies across the global securities markets. The index is weighted based on the distribution of assets in the global hedge fund industry. It is a tradeable index of actual hedge funds. It is a suitable benchmark for the Crescat Global Macro private fund which has also traded in multiple asset classes and applied a multi-disciplinary investment process since inception. HFRX EQUITY HEDGE INDEX. The HFRX Equity Hedge Index represents an investable index of hedge funds that trade both long and short in global equity securities. Managers of funds in the index employ a wide variety of investment processes. They may be broadly diversified or narrowly focused on specific sectors and can range broadly in terms of levels of net exposure, leverage employed, holding periods, concentrations of market capitalizations and valuation ranges of typical portfolios. It is a suitable benchmark for the Crescat Long/Short private fund, which has also been predominantly composed of long and short global equities since inception. PHILADELPHIA STOCK EXCHANGE GOLD AND SILVER INDEX. The Philadelphia Stock Exchange Gold and Silver Index is the longest running index of global precious metals mining stocks. It is a diversified, capitalization-weighted index of the leading companies involved in gold and silver mining. It is a suitable benchmark for the Crescat Precious Metals private fund and the Crescat Precious Metals SMA strategy, which have also been predominately composed of precious metals mining companies involved in gold and silver mining since inception. RUSSELL 1000 INDEX. The Russell 1000 Index is a market-cap weighted index of the 1,000 largest companies in US equity markets. It represents a broad scope of companies across all sectors of the economy. It is a commonly followed index among institutions. This index contains many of the same securities as the S&P 500 but is broader and includes some mid-cap companies. It is a suitable benchmark for the Crescat Large Cap SMA strategy, which has predominantly held and traded similar securities since inception. S&P 500 INDEX. The S&P 500 Index is perhaps the most followed stock market index. It is considered representative of the U.S. stock market at large. It is a market cap-weighted index of the 500 largest and most liquid companies listed on the NYSE and NASDAQ exchanges. While the companies are U.S. based, most of them have broad global operations. Therefore, the index is representative of the broad global economy. It is a suitable benchmark for the Crescat Global Macro and Crescat Long/Short private funds, and the Large Cap and Precious Metals SMA strategies, which have also traded extensively in large, highly liquid global equities through U.S.-listed securities, and in companies Crescat believes are on track to achieve that status. The S&P 500 Index is also used as a supplemental benchmark for the Crescat Precious Metals private fund and Precious Metals SMA strategy because one of the long-term goals of the precious metals strategy is low correlation to the S&P 500. References to indices, benchmarks or other measures of relative market performance over a specified period of time are provided for your information only. Reference to an index does not imply that the fund or separately managed account will achieve returns, volatility or other results similar to that index. The composition of an index may not reflect the manner in which a portfolio is constructed in relation to expected or achieved returns, portfolio guidelines, restrictions, sectors, correlations, concentrations, volatility or tracking. Separately Managed Account (SMA) disclosures: The Crescat Large Cap Composite and Crescat Precious Metals Composite include all accounts that are managed according to those respective strategies over which the manager has full discretion. SMA composite performance results are time-weighted net of all investment management fees and trading costs including commissions and non-recoverable withholding taxes. Investment management fees are described in Crescat’s Form ADV 2A. The manager for the Crescat Large Cap strategy invests predominantly in equities of the top 1,000 U.S. listed stocks weighted by market capitalization. The manager for the Crescat Precious Metals strategy invests predominantly in a global all-cap universe of precious metals mining stocks. Bloomberg News Disclosure: Bloomberg selection criteria is based on returns. The Bloomberg return table was compiled from people familiar, investor letters and other Bloomberg News reporting. The report is written by editor Erin Fuchs of Bloomberg News to acknowledge returns for month and year to date. Crescat Capital did not submit payment, outside of our employees’ Bloomberg subscriptions, for consideration or placement in these rankings. Our ranking may not be representative of any one client’s experience since it reflects the returns of a hypothetical, full fee-paying investor who has invested since inception. Ranking is not indicative of future performance. The displayed table is based on US submissions only and the number of submissions varies on a week-by-week basis. Crescat reports performance estimates and finalized numbers to Bloomberg as they are released and displays both favorable and unfavorable months at the discretion of the Bloomberg News team. Crescat Capital is not affiliated with Bloomberg News. Hedge Fund disclosures: Only accredited investors and qualified clients will be admitted as limited partners to a Crescat hedge fund. For natural persons, investors must meet SEC requirements including minimum annual income or net worth thresholds. Crescat’s hedge funds are being offered in reliance on an exemption from the registration requirements of the Securities Act of 1933 and are not required to comply with specific disclosure requirements that apply to registration under the Securities Act. The SEC has not passed upon the merits of or given its approval to Crescat’s hedge funds, the terms of the offering, or the accuracy or completeness of any offering materials. A registration statement has not been filed for any Crescat hedge fund with the SEC. Limited partner interests in the Crescat hedge funds are subject to legal restrictions on transfer and resale. Investors should not assume they will be able to resell their securities. Investing in securities involves risk. Investors should be able to bear the loss of their investment. Investments in Crescat’s hedge funds are not subject to the protections of the Investment Company Act of 1940. Performance data is subject to revision following each monthly reconciliation and annual audit. Current performance may be lower or higher than the performance data presented. The performance of Crescat’s hedge funds may not be directly comparable to the performance of other private or registered funds. Hedge funds may involve complex tax strategies and there may be delays in distribution tax information to investors. Investors may obtain the most current performance data, private offering memoranda for Crescat’s hedge funds, and information on Crescat’s SMA strategies, including Form ADV Part II, by contacting Linda Smith at (303) 271-9997 or by sending a request via email to [email protected]. See the private offering memorandum for each Crescat hedge fund for complete information and risk factors. © 2023 Crescat Capital LLC Important Disclosures Performance data represents past performance, and past performance does not guarantee future results. An individual investor’s results may vary due to the timing of capital transactions. Performance for all strategies is expressed in U.S. dollars. Cash returns are included in the total account and are not detailed separately. Investment results shown are for taxable and tax-exempt clients and include the reinvestment of dividends, interest, capital gains, and other earnings. Any possible tax liabilities incurred by the taxable accounts have not been reflected in the net performance. Performance is compared to an index, however, the volatility of an index varies greatly and investments cannot be made directly in an index. Market conditions vary from year to year and can result in a decline in market value due to material market or economic conditions. There should be no expectation that any strategy will be profitable or provide a specified return. Case studies are included for informational purposes only and are provided as a general overview of our general investment process, and not as indicative of any investment experience. There is no guarantee that the case studies discussed here are completely representative of our strategies or of the entirety of our investments, and we reserve the right to use or modify some or all of the methodologies mentioned herein. This presentation is not an offer to sell securities of any investment fund or a solicitation of offers to buy any such securities. Securities of a fund managed by Crescat may be offered to selected qualified investors only by means of a complete offering memorandum and related subscription materials which contain significant additional information about the terms of an investment in the Fund and which supersedes information herein in its entirety. Any decision to invest must be based solely upon the information set forth in the Offering Documents, regardless of any information investors may have been otherwise furnished, and should be made after reviewing such Offering Documents, conducting such investigations as the investor deems necessary and consulting the investor’s own investment, legal, accounting and tax advisors in order to make an independent determination of the suitability and consequences of an investment in the Fund. Risks of Investment Securities: Diversity in holdings is an important aspect of risk management, and CPM works to maintain a variety of themes and equity types to capitalize on trends and abate risk. CPM invests in a wide range of securities depending on its strategies, as described above, including but not limited to long equities, short equities, mutual funds, ETFs, commodities, commodity futures contracts, currency futures contracts, fixed income futures contracts, private placements, precious metals, and options on equities, bonds and futures contracts. The investment portfolios advised or sub-advised by CPM are not guaranteed by any agency or program of the U.S. or any foreign government or by any other person or entity. The types of securities CPM buys and sells for clients could lose money over any timeframe. CPM’s investment strategies are intended primarily for long-term investors who hold their investments for substantial periods of time. Prospective clients and investors should consider their investment goals, time horizon, and risk tolerance before investing in CPM’s strategies and should not rely on CPM’s strategies as a complete investment program for all of their investable assets. Of note, in cases where CPM pursues an activist investment strategy by way of control or ownership, there may be additional restrictions on resale including, for example, volume limitations on shares sold. When CPM’s private investment funds or SMA strategies invest in the precious metals mining industry, there are particular risks related to changes in the price of gold, silver and platinum group metals. In addition, changing inflation expectations, currency fluctuations, speculation, and industrial, government and global consumer demand; disruptions in the supply chain; rising product and regulatory compliance costs; adverse effects from government and environmental regulation; world events and economic conditions; market, economic and political risks of the countries where precious metals companies are located or do business; thin capitalization and limited product lines, markets, financial resources or personnel; and the possible illiquidity of certain of the securities; each may adversely affect companies engaged in precious metals mining related businesses. Depending on market conditions, precious metals mining companies may dramatically outperform or underperform more traditional equity investments. In addition, as many of CPM’s positions in the precious metals mining industry are made through offshore private placements in reliance on exemption from SEC registration, there may be U.S. and foreign resale restrictions applicable to such securities, including but not limited to, minimum holding periods, which can result in discounts being applied to the valuation of such securities. In addition, the fair value of CPM’s positions in private placements cannot always be determined using readily observable inputs such as market prices, and therefore may require the use of unobservable inputs which can pose unique valuation risks. Furthermore, CPM’s private investment funds and SMA strategies may invest in stocks of companies with smaller market capitalizations. Small- and medium-capitalization companies may be of a less seasoned nature or have securities that may be traded in the over-the-counter market. These “secondary” securities 12 often involve significantly greater risks than the securities of larger, better-known companies. In addition to being subject to the general market risk that stock prices may decline over short or even extended periods, such companies may not be well-known to the investing public, may not have significant institutional ownership and may have cyclical, static or only moderate growth prospects. Additionally, stocks of such companies may be more volatile in price and have lower trading volumes than larger capitalized companies, which results in greater sensitivity of the market price to individual transactions. CPM has broad discretion to alter any of the SMA or private investment fund’s investment strategies without prior approval by, or notice to, CPM clients or fund investors, provided such changes are not material. Benchmarks HFRX GLOBAL HEDGE FUND INDEX. The HFRX Global Hedge Fund Index represents a broad universe of hedge funds with the capability to trade a range of asset classes and investment strategies across the global securities markets. The index is weighted based on the distribution of assets in the global hedge fund industry. It is a tradeable index of actual hedge funds. It is a suitable benchmark for the Crescat Global Macro private fund which has also traded in multiple asset classes and applied a multi-disciplinary investment process since inception. HFRX EQUITY HEDGE INDEX. The HFRX Equity Hedge Index represents an investable index of hedge funds that trade both long and short in global equity securities. Managers of funds in the index employ a wide variety of investment processes. They may be broadly diversified or narrowly focused on specific sectors and can range broadly in terms of levels of net exposure, leverage employed, holding periods, concentrations of market capitalizations and valuation ranges of typical portfolios. It is a suitable benchmark for the Crescat Long/Short private fund, which has also been predominantly composed of long and short global equities since inception. PHILADELPHIA STOCK EXCHANGE GOLD AND SILVER INDEX. The Philadelphia Stock Exchange Gold and Silver Index is the longest running index of global precious metals mining stocks. It is a diversified, capitalization-weighted index of the leading companies involved in gold and silver mining. It is a suitable benchmark for the Crescat Precious Metals private fund and the Crescat Precious Metals SMA strategy, which have also been predominately composed of precious metals mining companies involved in gold and silver mining since inception. RUSSELL 1000 INDEX. The Russell 1000 Index is a market-cap weighted index of the 1,000 largest companies in US equity markets. It represents a broad scope of companies across all sectors of the economy. It is a commonly followed index among institutions. This index contains many of the same securities as the S&P 500 but is broader and includes some mid-cap companies. It is a suitable benchmark for the Crescat Large Cap SMA strategy, which has predominantly held and traded similar securities since inception. S&P 500 INDEX. The S&P 500 Index is perhaps the most followed stock market index. It is considered representative of the U.S. stock market at large. It is a market cap-weighted index of the 500 largest and most liquid companies listed on the NYSE and NASDAQ exchanges. While the companies are U.S. based, most of them have broad global operations. Therefore, the index is representative of the broad global economy. It is a suitable benchmark for the Crescat Global Macro and Crescat Long/Short private funds, and the Large Cap and Precious Metals SMA strategies, which have also traded extensively in large, highly liquid global equities through U.S.-listed securities, and in companies Crescat believes are on track to achieve that status. The S&P 500 Index is also used as a supplemental benchmark for the Crescat Precious Metals private fund and Precious Metals SMA strategy because one of the long-term goals of the precious metals strategy is low correlation to the S&P 500. References to indices, benchmarks or other measures of relative market performance over a specified period of time are provided for your information only. Reference to an index does not imply that the fund or separately managed account will achieve returns, volatility or other results similar to that index. The composition of an index may not reflect the manner in which a portfolio is constructed in relation to expected or achieved returns, portfolio guidelines, restrictions, sectors, correlations, concentrations, volatility or tracking. Separately Managed Account (SMA) disclosures: The Crescat Large Cap Composite and Crescat Precious Metals Composite include all accounts that are managed according to those respective strategies over which the manager has full discretion. SMA composite performance results are time-weighted net of all investment management fees and trading costs including commissions and non-recoverable withholding taxes. Investment management fees are described in Crescat’s Form ADV 2A. The manager for the Crescat Large Cap strategy invests predominantly in equities of the top 1,000 U.S. listed stocks weighted by market capitalization. The manager for the Crescat Precious Metals strategy invests predominantly in a global all-cap universe of precious metals mining stocks. Hedge Fund disclosures: Only accredited investors and qualified clients will be admitted as limited partners to a Crescat hedge fund. For natural persons, investors must meet SEC requirements including minimum annual income or net worth thresholds. Crescat’s hedge funds are being offered in reliance on an exemption from the registration requirements of the Securities Act of 1933 and are not required to comply with specific disclosure requirements that apply to registration under the Securities Act. The SEC has not passed upon the merits of or given its approval to Crescat’s hedge funds, the terms of the offering, or the accuracy or completeness of any offering materials. A registration statement has not been filed for any Crescat hedge fund with the SEC. Limited partner interests in the Crescat hedge funds are subject to legal restrictions on transfer and resale. Investors should not assume they will be able to resell their securities. Investing in securities involves risk. Investors should be able to bear the loss of their investment. Investments in Crescat’s hedge funds are not subject to the protections of the Investment Company Act of 1940. Performance data is subject to revision following each monthly reconciliation and annual audit. Current performance may be lower or higher than the performance data presented. The performance of Crescat’s hedge funds may not be directly comparable to the performance of other private or registered funds. Hedge funds may involve complex tax strategies and there may be delays in distribution tax information to investors. Investors may obtain the most current performance data, private offering memoranda for Crescat’s hedge funds, and information on Crescat’s SMA strategies, including Form ADV Part II, by contacting Linda Smith at (303) 271-9997 or by sending a request via email to [email protected]. See the private offering memorandum for each Crescat hedge fund for complete information and risk factors. |
Original Post
Editor’s Note: The summary bullets for this article were chosen by Seeking Alpha editors.
Read the full article here


