
Investment thesis
From 2005 to 2022, D.R. Horton, Inc. (NYSE:DHI) revenue grew at a CAGR of 5 %. During this period there was a strong correlation between its revenue and Housing Starts.
Housing Starts are cyclical. But over the past 70 years, there was no growth in the long-term annual average Housing Starts. As such, you should view DHI as a cyclical company, but with a small growth path.
A valuation of DHI on such a basis with different gross profit margin assumptions showed that there is not enough margin of safety. This is even the case if you assumed that there would be a 1/3 increase in the long-term annual average Housing Starts.
Thrust of my analysis
In my article “Home Builders’ Base Rates: A Reference For Better Fundamental Analysis”, I identified 9 listed home builders. These are companies with readily available financial data from 2005 to 2022 – the latest peak-to-peak Housing Starts cycle. DHI is one of the companies on that list.
I had previously determined the intrinsic values of Lennar, Toll Brothers, PulteGroup, NVR, and M.D.C. based on their performance over the 2005 to 2022 cycle. Refer to the respective articles if you want the details.
I will analyze and value DHI using the same approach as those for the others. You can then compare them on an “apple-to-apple” basis. This is the sixth article in my series to determine the cyclical values of the top 9 homebuilders.
My approach for all the companies can be summarized as follows:
- Verify that the company’s performance is correlated to the Housing Starts. Housing Stars is cyclical thus making the company a cyclical one.
- Determine the normalized or through-the-cycle performance of the company based on the Housing Starts.
- I considered 2 views of the long-term annual average Housing Starts – 1.5 million units and 2.0 million units. For both cases, I assumed that there is no growth in the long-term annual average Housing Starts.
You can read the rationale/basis for the above approach from the previous articles.
In 2022, DHI reported its performance based on 4 segments – Homebuilding, Forestar, Financial Services, and Rental.
For my analysis, I considered Forestar as part of the homebuilding operations. I also ignored the Rental segment as this was only 1.5 % of the consolidated revenue in 2022. Besides this was a “recent” segment as DHI only reported this from 2020 in a retrospective manner in its 2022 Form 10k.
My focus was on the performance over the 2005 to 2022 cycle. The crux is then determining the normalized earnings for this period. In this context, I used the following equation for the Gross Profit for the homebuilding operations.
Gross Profits = Closed units X Average Selling Price X Cyclical Gross Profit Margins.
The Cyclical Gross Profit Margins were assumed to be the average 2005 to 2022 Gross Profit Margins (normalized margins).
The above formula was along the lines of Damodaran suggestion to reflect the current size of the business.
The financial services operations only contributed less than 3% of the total revenue in 2022. I thus modeled the revenue for this operation based on a linear regression equation. The equation linked the revenue of the financial services operations with that of the homebuilding. This was derived using the EXCEL plotting function as illustrated in Chart 1.
Chart 1: Link between Finance Services Revenue and Homebuilding Revenue (Author)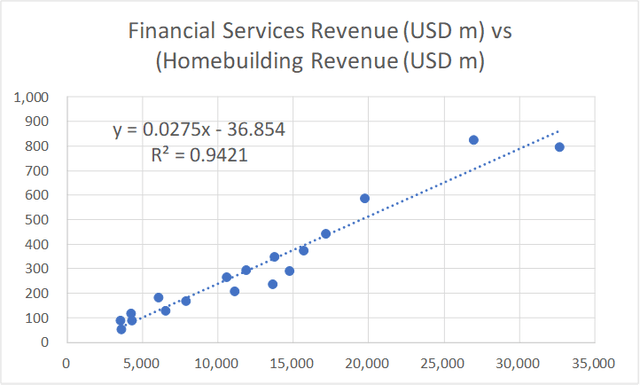
Cyclical sector
DHI operates in a cyclical sector as acknowledged by the company in its 2022 Form 10k.
“The homebuilding, lot development, and rental housing industries are cyclical…”
However, the company believes that as the largest and most geographically diversified homebuilder, this:
“…lowers our operational risks by mitigating the effects of local and regional economic cycles…”
But as can be seen from Chart 2, from 2005 to 2022, there is a 0.70 correlation between its revenue and Housing Starts.
Chart 2: Correlation between Revenue and Housing Starts (Author)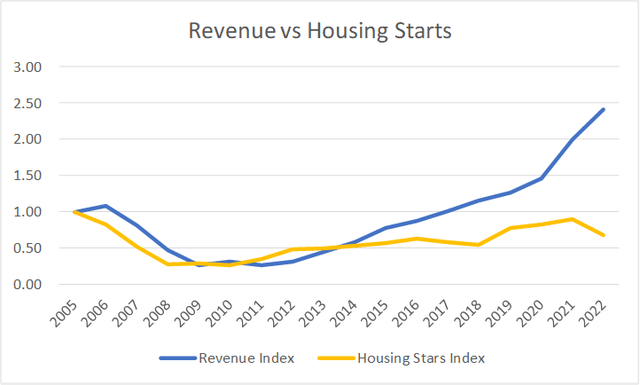
Notes to Chart 2: DHI values were based on its Sept financial year end values. The Housing Starts were based on the Dec year end values.
You can see from Chart 2 that from 2016, DHI revenue seemed to be trending up at a higher rate than the Housing Starts. But this was due to increases in the average selling prices in addition to the volume as shown in Chart 3. If you consider just volume (Closed units), the 2005 to 2022 correlation increased to 0.79.
Notwithstanding the size and geographical spread, DHI is still affected by the housing cycle.
Chart 3: Correlation between Homebuilding metrics and Housing Starts (Author)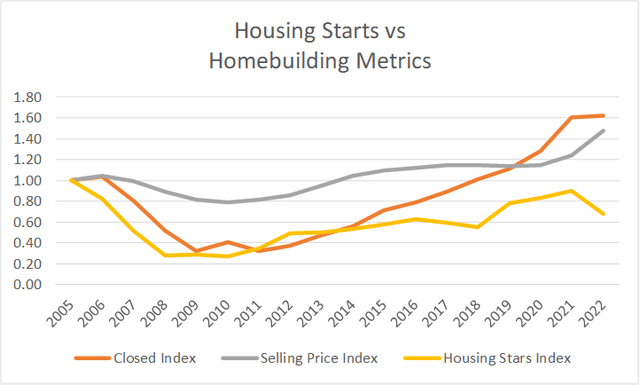
Notes to Chart 3: DHI values were based on its Sept financial year end values. The Housing Starts were based on the Dec year end values.
In my previous articles of this series, I drew the following conclusions based on my analysis of the Housing Starts and House Price Index. Refer to them for the details.
- Over the past 70 years, there is no growth in the long-term annual average Housing Starts. I took this long-term average as 1.5 million units per year.
- In the past 2 years, Housing Starts seemed to be at the long-term annual average level.
- Over the past 70 years, there have been 4 occasions when the annual Housing Starts had exceeded 2 million units.
- You can see from Chart 2 that Housing Starts starting to decline in 2022. Is the current drop in Housing Starts a temporary pullback from an uptrend? Or is it the start of its downtrend leg?
- While there is no growth in the annual average Housing Starts, there was long-term price growth. But the price growth was more significant from 2016 as can be seen from Chart 4.
I used these conclusions to determine the various parameters and assumptions for my valuation of DHI.
If you compare Chart 3 with Chart 4, you can see that while the House Price Index doubled from 2014 to 2022, DHI’s selling price had a lower growth rate. This should make you wonder about whether there were benefits from being big and diversified geographically.
Chart 4: House Price Index (Author)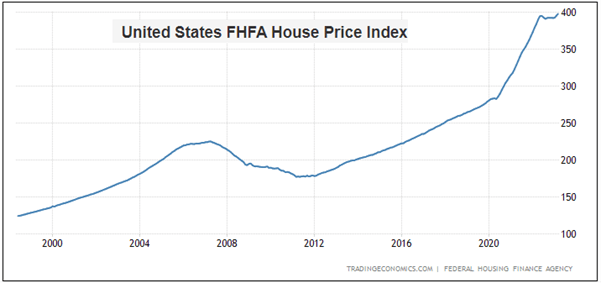
While nobody disputed the cyclical nature of the sector, we have different views on the long-term annual Housing Starts:
- I have assumed that there is no change to the long-term annual average Housing Starts. My basic argument is that 70 years of data cannot be wrong.
- There are many Seeking Alpha readers who believe that there is some fundamental change to this long-term annual average Housing Starts.
I do not have a crystal ball on how the future will unfold. As such I will value DHI under both views and let you decide what to do. I have already covered the pros and cons of these 2 views in the previous articles. Refer to them.
Performance
I look at 3 metrics to get an overview of the performance over the cycle – revenue, profit after tax (PAT), and gross profitability (gross profits/total assets).
Chart 5: DHI Performance Index (Author)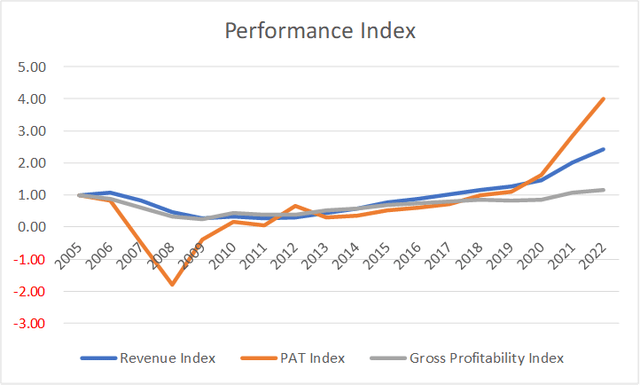
Chart 5 shows the performance of DHI over the 2005 to 2022 cycle. During this period revenue grew at 5% CAGR. But this was due to a combination of growth in the number of units closed and the increase in the average selling prices. Refer to Table 1. Volume growth was the bigger contributor.
Note that from 2012 to 2022, DHI spent about USD 1.3 b on cash acquisitions. Considering that its average total assets over this period was USD 15.0 b, I would consider the acquisition growth significant.
Table 1. Growth rates (Author)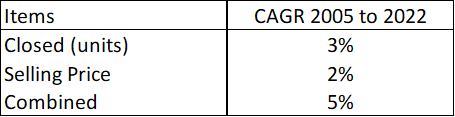
Over the 18 years cycle, DHI incurred losses for 3 years. These were due to large asset write-offs during the trough part of the Housing Starts cycle. To give you a sense of the scale, the total write-off in 2007 to 2009 was 37 % of the 2007 total assets. For the other 6 homebuilders that I covered in this series, the ratio ranged from 19 % to 44 % with an average of 31%. Does it mean that being bigger led to larger % of write-off?
In 2022, DHI is a much bigger company compared to that in 2005. Its 2022 revenue is 2 ½ bigger while its Net Income is 4 times larger. Unfortunately, its capital efficiency as measured by the gross profitability did not improve.
You can see from Chart 5 that for most of the past 18 years, the gross profitability was below the 2005 level. It only went above the 2005 level in the past 2 years.
In its 2022 Form 10k, the company talked about the advantages it can get from its size.
“We believe that our national, regional, and local scale of operations provides us with benefits…such as:
- Greater access to and lower cost of capital…
- Volume discounts and rebates from…suppliers and lower labor rates
- Enhanced leverage of our general and administrative activities…”
The above comments and the gross profitability numbers do not jive.
What does all this mean? It may be big and diversified geographically, but there are questions about its ability to operate efficiently over the cycle. I would also be wary about any value that incorporates growth.
Financial position
I would like cyclical companies to be financially sound going into the downtrend leg of a cycle as I do not know how severe the downtrend will be.
I used 4 criteria to assess financial strength. I would rate DHI as average as it did ok for the first 2 criteria but not so well on the latter two as follows.
As of the end of Dec 2022, DHI had USD 0.24 billion in cash. This is about 8 % of its total assets. This is in line with the ratios for Lennar, TOL Brothers, and Pulte which ranged from 7 % to 12 %. However, this is much lower than the 44 % for NVR and the 21 % for MDC.
It has a Debt Equity ratio of 0.32 at the end of Sep 2022. My base rate for the sector was a mean Debt Equity ratio of 0.41 for 2022.
Over the past 18 years, it generated an average of USD 379 million per year in Cash Flow from Operations compared to the average PAT of USD 1.07 b per year. This seemed a low cash-generation ratio. The mean Cash Flow from Operations over the same period for my base rate was USD 328 million compared to the mean PAT of USD 405 million ie higher cash-generation ratio.
Over the cycle, DHI managed to generate positive Cash Flow from Operations annually for 12 out of the 18 years. Among the 9-panel companies (including DHI), there were 3 companies that did worse than DHI.
I am surprised by the above findings as I had expected DHI to be much stronger financially given its size and geographically spread.
Valuation
I valued DHI based on the single-stage Free Cash Flow to the Firm (FCFF) model.
I focused on 3 Scenarios:
- Scenario 1. I assumed that 2021/22 represented the long-term annual average Housing Starts of 1.5 million units.
- Scenario 2. This assumed that the long-term annual average Housing Starts was increased to 2.0 million units.
- Scenario 3 – This assumed a non-cyclical scenario. I assumed that the 2021 and 2022 performances represented the long-term performance. As such I used the actual average 2021 and 2022 Gross Profit Margins.
Table 2 summarized the results. You can see that there is no margin of safety under Scenario 1.
But the margins of safety under Scenarios 2 and 3 are greater than my 30 % target.
While there is a margin of safety under Scenario 3, I do not think that this is realistic as the evidence points to DHI being a cyclical company.
Note that the value under Scenario 2 is over-estimated as it assumed that we are now at the 2.0 million units of Housing Starts. It would take a few more years to reach this level.
A valuation assuming that it would take another 5 years to reach the 2.0 million units, using a 2-stage FCFF growth model, resulted in a 5 % margin of safety. This meant the there is also not a sufficient margin of safety under Scenario 2.
Table 2: Summary of DHI Valuation (Author)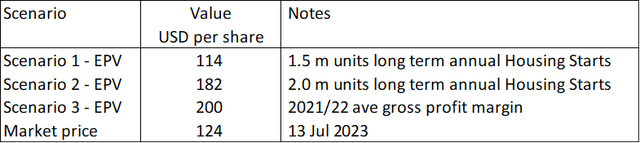
Sensitivity analysis
For the valuation shown in Table 2, I took the average Gross Profit Margins for each year from 2005 to 2022.
But in my earlier Lennar article, I computed the normalized Gross Profit Margins = (sum of 2005 to 2022 Gross Profits) divided by the (sum of the 2005 to 2022 revenue).
This was different from what I did for DHI above. If I had adopted the Lennar approach, the value of DHI would be higher.
- Under Scenario 1, there would now be an 11 % margin of safety.
- Under Scenario 2, assuming that it would take 5 years to reach the 2.0 million annual Housing Starts, the margin of safety would now be 24%.
My target margin of safety is 30%. This meant that both Scenarios 1 and 2 did not provide enough margin of safety.
Valuation model
I valued DHI on the same basis as I did for the other homebuilders using the single-stage Free Cash Flow to the Firm (FCFF) model.
Value of the operating assets of the firm = FCFF X (1 + g) / (WACC – g)
Where:
FCFF = EBIT X (1 – t) X (1 – Reinvestment rate)
g = growth rate = the 2005 to 2022 CAGR of 5.1%.
t = tax rate based on the past 3 years’ average rate.
WACC = weighted average cost of capital derived from the first page of a Google search for the term “DHI WACC” as summarized in Table 3.
Table 3: Estimating the WACC (Various)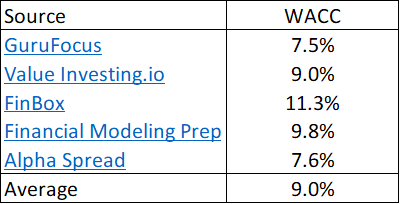
The reinvestment rate was derived from the fundamental growth equation.
Growth = Reinvestment rate X Return
Return = EBIT(1-t) / Total Capital Employed
EBIT = Gross profits – Selling, Admin, and Selling or SGA expenses – Other expenses and asset write-downs
Gross Profits
The Gross Profits for DHI were derived as shown in Table 4. The key assumption here is that the sector was operating at the long-term annual average Housing Starts in 2021/22. As such the average 2021/22 Closed units and Average Selling Price represented the cyclical performance.
Table 4: Deriving the Gross Profits (Author)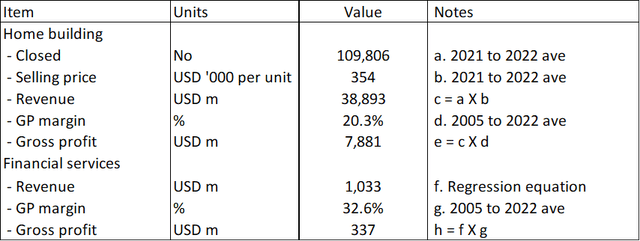
Notes to Table 4: This is computation assuming 2.0 million Housing Starts. The Closed units = 2021/22 average Closed units X (2/1.5).
The Gross Profits for the homebuilding operations = Closed units X Average Selling Price X Gross Profit Margins.
The Gross Profits for the financial services operations = Revenue X Gross Profit Margins.
The cyclical Gross Profit Margins for both operations were assumed to be the 2005 to 2022 average values.
The revenue for the financial services we derived based on the linear regression equation using EXCEL as shown earlier in Chart 1 where:
- Revenue for the homebuilding operations was the independent variable.
- Revenue for the financial services operations was the dependent variable
Sample calculation
Table 5 shows a sample calculation for the intrinsic value.
Table 5: Calculating the intrinsic value (Author)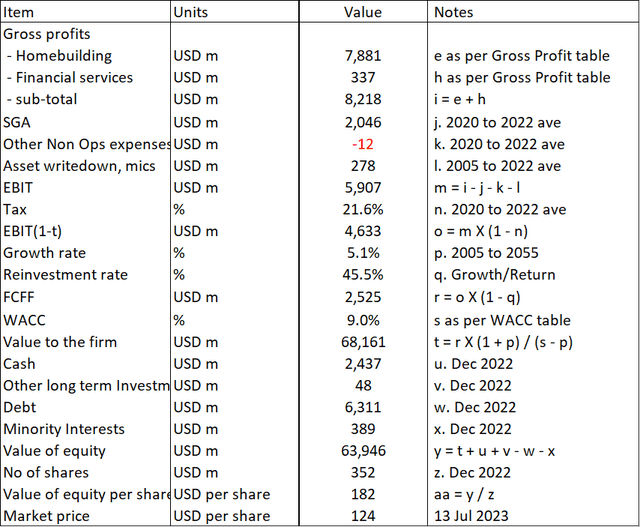
Notes to Table 5: Over the past 18 years, DHI incurred some asset write-downs and other one-off charges. I included the average in my valuation. This is computation assuming 2.0 million Housing Starts.
2-stage FCFF model
I used this model for the situation where it would take another 5 years to reach the 2.0 million long-term average annual Housing Starts. The key assumptions were:
- The annual growth rates for the next 5 years were set such that the 2022 revenue grew to that based on the 2.0 million Housing Starts by 2027.
- The terminal value in 2027 was the value based on the 2.0 million Housing Starts as per Scenario 2 in Table 2.
- The discount rate was based on the 9.0% shown in Table 3.
The calculation is illustrated in Table 6.
Table 6. Two-stage valuation model (Author)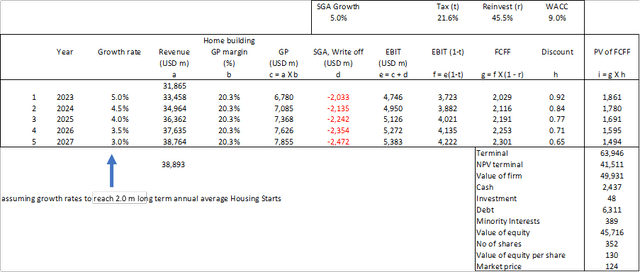
Notes to Table 6.
a) Starting with 2022
b) Based on 2005 to 2022 average
c) a X b
d) Assumed 5% growth rate based on 2020 to 2022 average
Risks and limitations
I would summarize the risks and limitations of my valuation into 3:
- High WACC.
- High growth.
- 2021/22 averages.
Part of the reason for the 9.0 % WACC was because of the current high risk-free rate and equity risk premium. This is due to the uncertainty associated with the high inflation rates, possible recession, and the Ukraine invasion.
If you are going to look at the value over the cycle, I would argue that you should also consider the values over the cycle. This meant lower values for the various parameters. As such my valuation is conservative.
The 5.1 % growth assumption I used is a very optimistic one as this is higher than the long-term USD GDP growth rate of 4%. I have mentioned that this growth rate was a combination of organic and acquisition growths. Given DHI’s size, you may wonder how long it can continue to grow via acquisitions. Remember that the valuation model assumed growth in perpetuity.
Furthermore, there is hardly any margin of safety under both Scenarios 1 and 2 with this optimistic growth assumption. If I had used a more conservative growth rate, then there would not be any margin of safety. This meant that my valuation is optimistic.
I would like to think that the effect of the WACC and growth cancels each other.
2021/22 averages
In my previous MDC article, I posted the following dilemma.
- The average annual Housing Starts in 2021/22 is about 1.5 million units, which is about the same as the long-term average annual Housing Starts.
- I have thus assumed that the average 2021/22 values for the Closed units and Selling Price are good representations of the cyclical values.
- I have used this to determine the Closed units and Selling Prices for Scenario 1.
- But if you accept this argument, shouldn’t the 2021/22 average Gross Profits also represent the cyclical Gross Profits?
Using this average as the value for item “i” in my valuation model as per Table 5, I obtained an intrinsic value of USD 200 per share. This is equal to a 62 % margin of safety.
We now have 2 different approaches for estimating the intrinsic value over the cycle – Scenario 1 and this gross profit method.
I now believe that this gross profit method is wrong. For the gross profit method to be realistic, the 2021/22 gross profits must represent the average margin over the cycle.
In other words, the gross profit margins for the various years must fluctuate around this 2021/22 level. For example,
- During the trough leg of the cycle, the gross profit margins must be lower than the 2021/22 average margin.
- During the peak part of the cycle, the gross profit margins must be higher than the 2021/22 average margin.
If you look at DHI’s actual gross profit margins over the past 30 years as per Chart 6, you can that this is not true.
Chart 6. DHI Gross Profit Margins vs Housing Starts over the past 30 years (Author)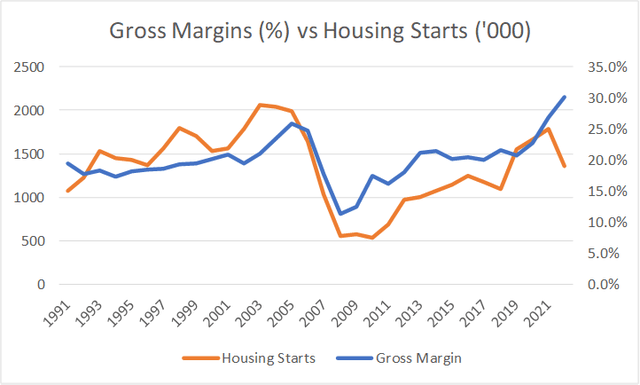
The average gross profit margin over the 30 years was 20%.
During this period, you can see 6 occasions when the Housing Starts were at 1.5 million units. But when I looked at the gross profit margins when these occurred, I counted only 3 occasions with a 20 % margin.
There is thus no conclusive evidence that the gross profit margin when the Housing Starts is at 1.5 million represents the cyclical margin.
Of course I am looking at historical data. But DHI is a cyclical company. The “repeated patterns” of cyclical companies give me confidence that the past is a good indication of the future.
Conclusion
DHI is a cyclical company. Any analysis, and valuation of DHI should be based on its performance over the cycle.
I assumed that the cycle performance is represented by the 2005 to 2022 performance. This is pegging it to the latest peak-to-peak Housing Starts cycle.
My valuation of DHI on such a basis showed that I could not get a 30 % margin of safety even with various ways to calculate the gross profit margins. This is based on the view that there is no growth in the long-term annual average Housing Starts under Scenario 1.
Even if I assumed that there is a 1/3 increase in the long-term annual average Housing Starts as per Scenario 2, the margin of safety is still lower than my 30% cut-off.
As such, I would not invest in DHI at the current price.
I am a long-term value investor and my analysis and valuation are based on the long-term prospect of a company. I consider the performance over the cycle as the long-term view. This is not an analysis for those seeking to make money over the next few weeks or months.
Read the full article here

