Fundamentals
This week was quite a rollercoaster for gold prices, with some unexpected moves and reactions. Surprisingly, as of Friday midday, gold has seen a net gain.
Here’s the weekly breakdown for gold prices from September 11-15:
Gold started strong on Monday, maintaining close to the $1920/oz mark. The focus was on the upcoming Consumer Price Index (CPI) report on Wednesday, which many believed could be a challenge for gold. The anticipated inflation data results were viewed as a potential green light for another rate hike soon. On Tuesday, there was a collective move by traders to adjust positions ahead of the CPI release. This resulted in a roughly $10/oz dip for gold during the US morning trading hours, but it soon regained some ground, stabilizing near $1910.
Wednesday’s CPI release was mixed. Although core CPI decreased as predicted, the overall inflation was slightly above expectations. This didn’t seem to urgently push the Federal Open Market Committee (FOMC) to act. Gold’s price remained pretty steady after the report, holding around the $1910 mark even into Thursday.
On Thursday afternoon, news surfaced about a UAW strike in major US auto factories. This could significantly impact the US economy. While gold did climb a bit, it wasn’t until Friday morning that the market felt the full weight of this news combined with the anticipated Federal Reserve rate hike.
Interestingly, even with major U.S. stocks declining towards the week’s end, gold received more attention as a safer bet, causing its price to rise. As of now, it appears that spot gold may close the week at or above $1925/oz. Next week, all eyes are on the FOMC meeting on Wednesday. It’s expected to bring significant news about potential rate hikes and updated economic forecasts for the next years.
Let’s take a look at next week’s standard deviation report published in the Market Place section as Mean reversion Trading and see what trading opportunities we can identify short-term.
GOLD: Weekly Standard Deviation Report
Sep. 16, 2023 11:22 AM ET.
Summary
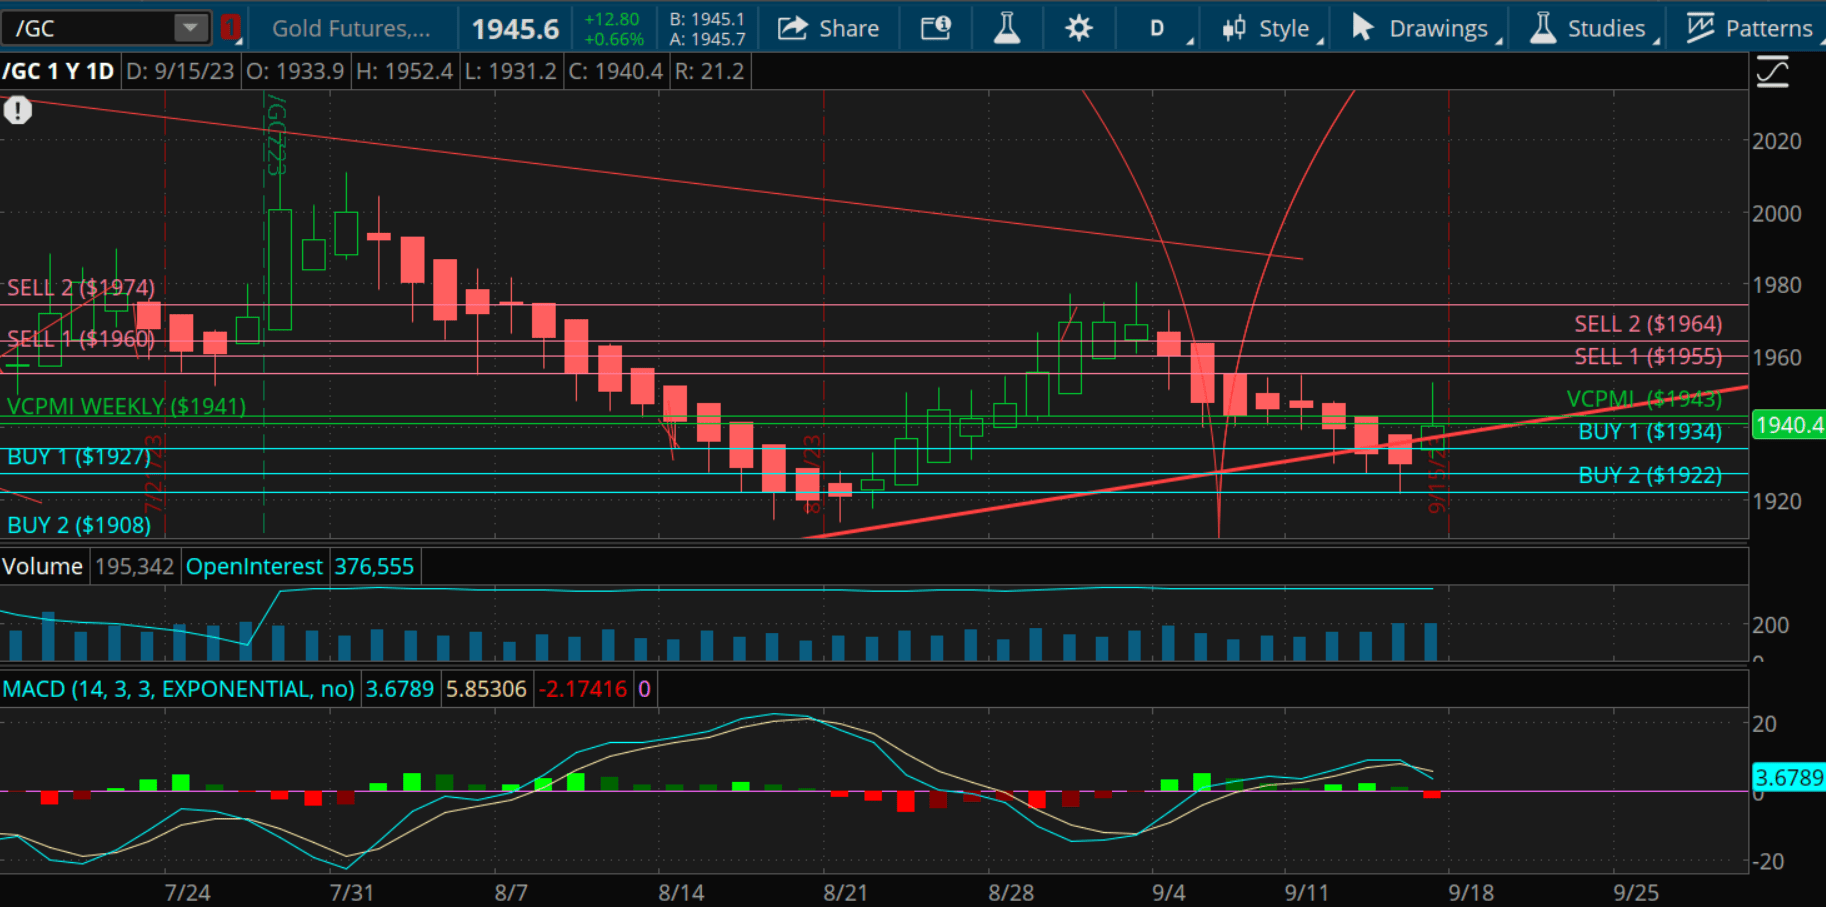
- Gold futures contract closed the week at a value of 1946.
- Weekly trend momentum leans bearish, but closing above the 9-day SMA would shift it to a neutral stance.
- Bullish price momentum confirmed by closing above the VC Weekly Price Momentum Indicator at 1943.
gold weekly (TOS)
Closing Value: The gold futures contract closed the week at a value of 1946.
Weekly Trend Momentum:
The market’s close below the 9-day Simple Moving Average (SMA) of 1955 serves as confirmation that the weekly trend momentum leans bearish. Should the futures contract close above this 9-day SMA, it would shift the weekly bullish short-term trend to a neutral stance.
Weekly Price Momentum:
An observation of the market closing above the VC Weekly Price Momentum Indicator, pegged at 1943, confirms a bullish price momentum for the week. A downward close below the VC PMI would revert the weekly bullish short-term trend back to neutral.
Weekly Price Indicator:
- For shorts: Consider taking profits during price corrections at the Buy 1 and 2 levels (1927 – 1908).
- For long positions: Utilize the 1908 level as a Stop Close Only and Good Till Cancelled order. Consider profit-taking when prices reach the Sell 1 and 2 levels of 1960 – 1974 during the week.
Upcoming Cycle: Investors should note that the next significant cycle due date is slated for 9.30.23.
Strategic Recommendations:
- For short positions: It is recommended to take profits between 1927 and 1908.
- For long positions: Profit-taking is advised between the levels of 1960 and 1974.
Disclaimer: The information in the Market Commentaries was obtained from sources believed to be reliable, but we do not guarantee its accuracy. Neither the information nor any opinion expressed herein constitutes a solicitation of the purchase or sale of any futures or options contracts. It is for educational purposes only.
Read the full article here


