Introduction
The independent U.S. refiner and marketer, Ohio-based Marathon Petroleum Corporation (NYSE:MPC), released its second-quarter 2023 results on August 1, 2023.
Note: I have followed MPC quarterly since 2018. This new article updates my article published on June 22, 2023.
CEO Mike Hennigan said in the conference call:
Beginning with our views on the macro environment, refining margins continued strong in the second quarter. Despite crack spreads incentivizing high refining utilization, product inventory levels remain low. Global capacity additions continue to progress slower than anticipated and we believe that global demand growth will remain strong.
Q2’23 Results Snapshot
Marathon Petroleum reported a better-than-expected adjusted income of $5.32 per share for the second quarter, compared with $10.61 last year.
Net income was $2,226 million, compared to $5,873 million in Q2’22. Revenues decreased significantly from $54.238 billion last year to $36.824 billion. The total costs and expenses were $31,016 million compared to $36,668 million last year.
During the second quarter, Marathon Petroleum repurchased $3.07 billion of shares. The company authorized an additional $5 billion share repurchase and has a remaining authorization of $9 billion.
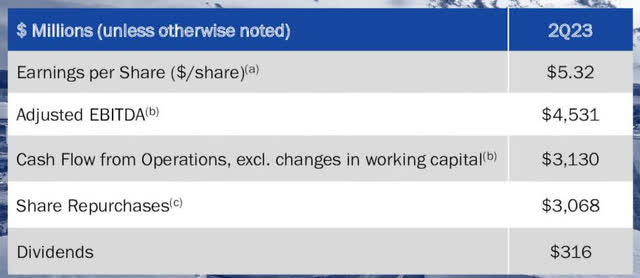
MPC Q2’23 Highlights (MPC Presentation)
The company’s operating income dropped significantly YoY due to the weaker-than-expected performance of its Refining & Marketing segment. The segment’s Operating income totaled $2.29 billion compared with $7.13 billion last year, as shown below:
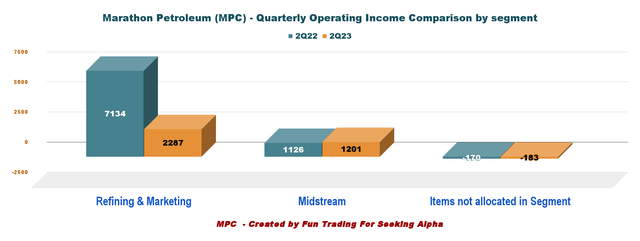
MPC Quarterly Operating Income Q2’22 versus Q2’23 (Fun Trading)
Stock Performance
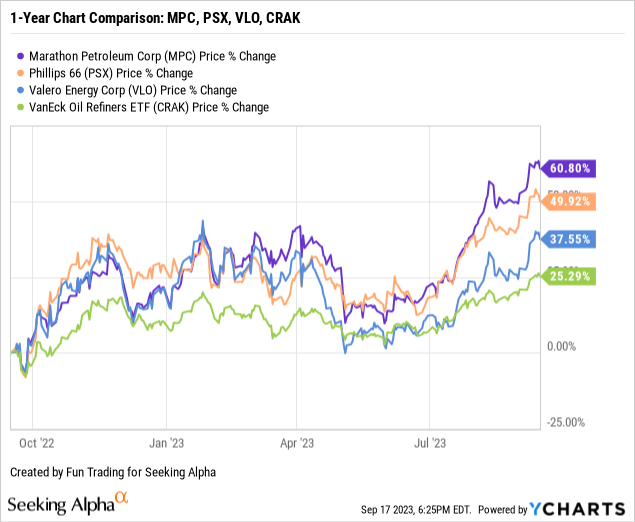
Marathon Petroleum has outperformed Phillips 66 (PSX), Valero Energy (VLO), and VanEck Oil Refiners ETF (CRAK). MPC is up 61% YoY.
Investment Thesis
Marathon Petroleum Corporation has outperformed the refining group over the past year. The main driver of this solid performance is that the company has strengthened its assets and improved its performance significantly, providing superior returns.
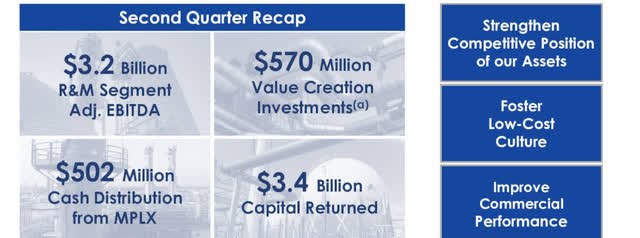
MPC Superior Returns (MPC Presentation)
Marathon Petroleum also owns a majority stake (64.6%) in a midstream partnership called MPLX LP (MPLX). Most of Marathon’s midstream segment is operated by MPLX LP. As indicated earlier, the Refining & Marketing, or R&M, is MPC’s main operational segment.
MPC has regularly outperformed MPLX on a one-year basis. On the other hand, MPLX LP is paying a higher dividend yield of 5.33%.
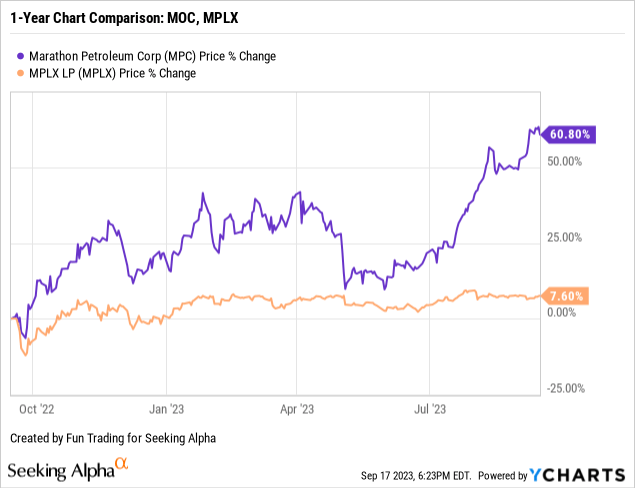
As I said in my prior article, the company has shown exceptional performance in 2022, and with oil prices down in Q2’23 from a record high, it is normal to notice lower returns in H1 2023.
However, oil prices have jumped significantly from Q2’23, and refiners have done very well in Q3’23, with increasing margins.
Global refiners are raking in hefty gains, fueled by a rebound from second-quarter lows in margins on making oil products such as diesel, jet fuel and gasoline, a trend that oil companies and experts expect will continue for the rest of 2023.
Refiners are optimistic about the bull run due to projected sustained strong demand growth and low inventory levels.
However, I believe all the goodies have already been factored in the stock price, and the sector looks overbought and ready for a technical retracement.
Thus, trading LIFO for about 50% of your long-term position is prudent in case of a steep retracement happening at any time now.
Keeping a long-term holding makes sense from an investor’s perspective. As shown below, MPC pays a dividend yield of 1.95%, which is not negligible but still a little low compared to its peers, with PSX leading the group.

MPC Dividend Comparison (Fun Trading)
Revenues, Operating income, and profit margin compared with Valero Energy and Phillips 66 in Q2’23.

MPC Q2’23 Operating Income, margin MPC, VLO, PSX (Fun Trading)
The total shares outstanding diluted has been reduced by 21.8% YoY.
Margins by Region
Marathon Petroleum declared a global R&M margin of $22.10 per Bbl based on throughput per region. Margins dropped by 15.5% QoQ and are down 37.8% YoY.
Details below:
| Gulf Coast | Mid Continent | West Coast | Total |
| $19.24/per Bbl | $23.94/per Bbl | $25.42/per Bbl | $22.10/per Bbl |
Marathon Petroleum – Financial History: The Raw Numbers – Ending Second Quarter 2023
| Marathon Petroleum | Q2′22 | Q3’22 | Q4’22 | Q1’23 | Q2′23 |
| Total Revenues in $ Billion | 53.80 | 45.79 | 39.81 | 34.86 | 36.34 |
| Total Revenues and others in $ Billion | 54.24 | 47.24 | 40.09 | 35.08 | 36.82 |
| Net Income available to common shareholders in $ Million |
5,873 |
4,477 |
3,321 |
2,724 |
2,226 |
| EBITDA $ Million | 9,134 | 7,543 | 5,656 | 5,018 | 4,313 |
| EPS diluted in $/share | 10.95 | 9.06 | 7.09 | 6.09 | 5.32 |
| Operating cash flow in $ Million | 6,952 | 2,514 | 4,382 | 4,057 | 3,984 |
| CapEx in $ Million | 498 | 701 | 726 | 457 | 481 |
| Free Cash Flow in $ Million | 6,454 | 1,813 | 3,656 | 3,600 | 3,503 |
| Total Cash $ Billion | 13.32 | 11.14 | 11.77 | 11.45 | 11.45 |
| Debt Consolidated in $ Billion | 26.77 | 26.70 | 26.70 | 27.28 | 28.28* |
| Dividend per share in $ | 0.58 | 0.75 | 0.75 | 0.75 | 0.75 |
| Shares Outstanding (Diluted) in Million | 536 | 494 | 468 | 447 | 419 |
| Operating Income per Segment in $ million | Q2′22 | Q3’22 | Q4’22 | Q1’23 | Q2′23 |
| Refining & Marketing | 7,134 | 4,625 | 3,910 | 3,032 | 2,287 |
| Midstream | 1,126 | 1,176 | 1,088 | 1,213 | 1,201 |
| Items not allocated in the Segment | 68 | -173 | -244 | -184 | -183 |
Source: Company News.
* MPC debt is $6,877 million, and MPLX debt is $20,406 million in Q2’23, with a gross Debt-to-Capital ratio of 46% (consolidated).
Analysis: Earnings Details
1 – Revenues and other income were $36.82 billion in Q2’23
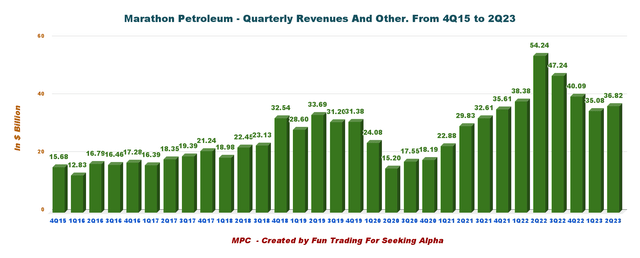
MPC Quarterly Revenues History (Fun Trading)
Note: Basic revenues were $36.34 Billion.
Marathon Petroleum reported a total income of $2.226 billion in the second quarter of 2023, or $5.32 per diluted share, compared to $5,873 million in Q2’22, beating analysts’ expectations. Total income was down 37.9% from the same quarter a year ago and down 18.3% sequentially.
Total Revenues were $36,824 million compared to $54,238 million last year.
The operating income from the Refining & Marketing and the Midstream units totaled $2,287 million and $1,201 million, respectively, exceeding expectations. However, operating income fell from the record Q2’22.
1.1 – Refining & Marketing
The company reported an operating income of $2,287 million, compared to only $7,134 million in the same quarter a year ago. The significant decrease was due to lower YoY margins and refined product sales from a decreased capacity utilization. The refining margin was $22.10 per barrel in Q2’23, down from $35.54 a year ago.
Capacity utilization in Q2’23 was 93%, down from 100% in Q2’22. The year-over-year drop was due to planned maintenance activity in the Mid-Continent and West Coast regions.
Throughput decreased from 3,145 mbpd in the year-ago quarter to 2,968 mbpd.
Finally, operating costs per barrel decreased to $5.15 from $5.19 last year.
Below is the Refinery margins history:
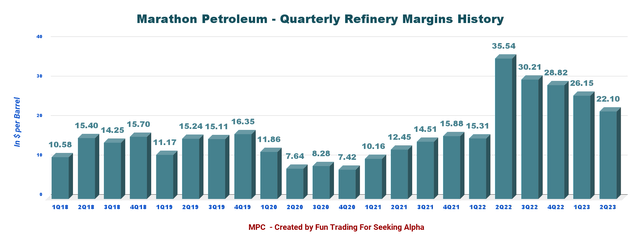
MPC Quarterly Refinery Margins (Fun Trading)
1.2 – Midstream – MPLX
Marathon Petroleum’s general and limited majority partners are MPLX LP. Segment profitability was $1,201 million, up 6.7% from $1,126 million in Q2’22. Better earnings were due to higher tariff rates and the stable, fee-based revenues from MPLX’s wide range of midstream energy services.
CFO Maryann Mannen said in the conference call (emphasis added):
Our midstream segment delivered strong second quarter results. Segment adjusted EBITDA while flat sequentially was 5% higher year-over-year. Our midstream business continues to grow and generate strong cash flows. We are advancing high-return growth projects anchored in the Marcellus and Permian basins.
2 – Q3’23 Outlook
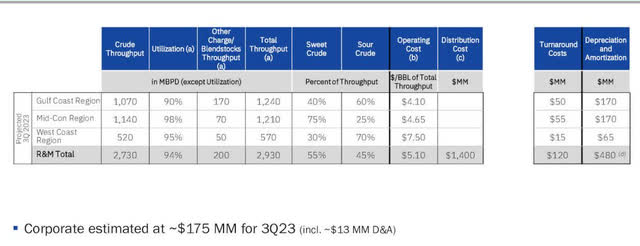
MPC 3Q23 Outlook (MPC Presentation)
CFO Maryann Mannen said in the conference call:
We expect crude throughput volumes of roughly 2.7 million barrels per day, representing utilization of 94%. Utilization is forecasted to be higher sequentially due to lower planned turnaround activity in the third quarter, and enhance mid-cycle margins, continue to incentivize high refining utilization. While we have not confirmed a start-up date, our throughput guidance assumes the reformer at the Galveston Bay refinery will be down for the entire quarter. Planned turnaround expense is projected to be approximately $120 million in the third quarter. Operating cost per barrel in the third quarter are expected to be $5.10
3 – Free cash flow was $3,503 million in Q2’23
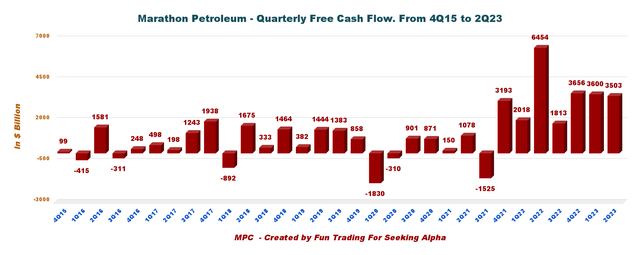
MPC Quarterly Free Cash Flow History (Fun Trading)
Note: Generic free cash flow is the cash from operations minus CapEx.
The trailing 12-month free cash flow was $12,572 million, with approximately $3,503 million in Q2’23.
4 – The total debt is $27.283 billion (consolidated) in Q2’23
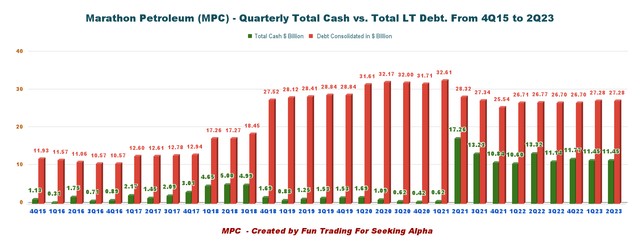
MPC Quarterly Cash versus Debt History (Fun Trading)
Note: The graph above indicates the debt on a consolidated basis.
MPLX’s debt is $6.877 billion. As shown below, the debt is $27.283 billion on a standalone basis, with a debt-to-capital ratio of 21% and 46% on a consolidated basis. Total cash is $11,454 million (MPC standalone cash was $10,699 million).
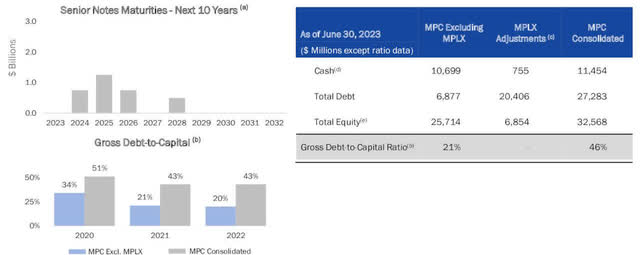
MPC Balance Sheet (MPC Presentation)
Technical Analysis (Short Term) and Commentary
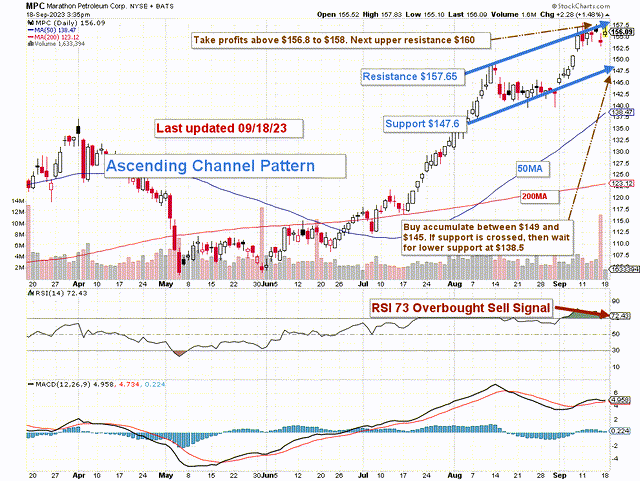
MPC TA Medium Term (Fun Trading StockCharts)
Note: The chart is adjusted for the dividend.
MPC forms an ascending channel pattern, with resistance at $157.65 and support at $147.6. RSI is now 73, which is a sell signal.
Ascending channel patterns are generally short-term bullish, moving higher within an ascending range, but these patterns usually form within longer-term downtrends as continuation patterns. Hence, I expect MPC to drop soon and potentially break down support.
The overall strategy is to keep a long-term position and use about 50% to trade LIFO while waiting for a higher final price target for your core position between $160 and $165 or keeping it and enjoying the dividend.
The trading strategy is to sell above $156.8 and $158 with a possible higher resistance at $160. I suggest waiting for a retracement between $149 and $145 to accumulate again, with potential lower support at $138.5.
Warning: The TA chart must be updated frequently to be relevant. It is what I am doing in my stock tracker. The chart above has a possible validity of about a week. Remember, the TA chart is a tool only to help you adopt the right strategy. It is not a way to foresee the future. No one and nothing can.
Read the full article here


