Investment briefing
The equity stock of Myers Industries (NYSE:MYE) has been hammered down in 2023 despite robust fundamentals and economic performance. Based on the critical investment facts outlined here, the facts pattern does not support this punishment in my view.
MYE is a company that works in the design, manufacturing, and marketing of a wide variety of plastic, metal, and rubber products. The company has 2 primary segments:
- The first segment is the material handling Segment, specializing in injection moulding, rotational moulding, and blow moulding. MYE manufactures a broad range of moulded products in this business, from small parts bins, to bulk shipping containers, to consumer fuel containers, and tanks for water and fuel, just to name a select few.
- The second segment is the distribution business. Its market is in distributing tools and so forth to tire, wheel, and under-vehicle services. These are used in many vehicles (passenger, heavy truck, and off-road). It is also in the production of tire repair and retreading products.
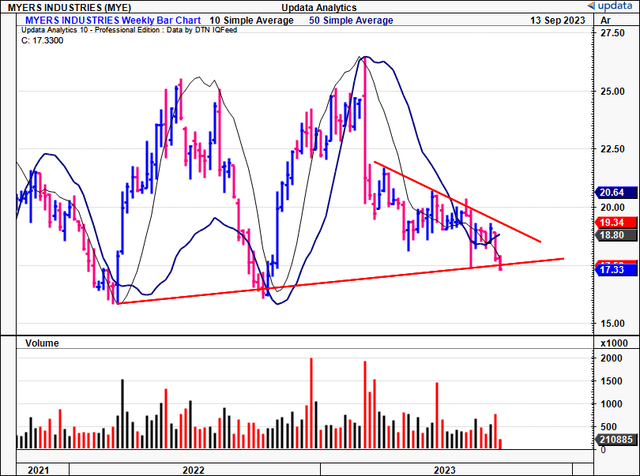
Both segments had a stellar year in ’22 but momentum has cooled off in ’23. But this doesn’t change the economic value MYE is creating for shareholders, not accurately reflected in its market value in my opinion. Net-net, I rate MYE a buy, eyeing $24 as the next price objective.
Figure 1.
Data: Updata
Critical facts forming the buy thesis
1. Overview of latest numbers
MYE put up Q2 revenues of $24.7 million, down 10.6% YoY, on gross margin of ~33%, a decompression of ~90bps. The downsides were underscored by weakness in its material handling segment, influenced by 1) decreased demand for RV and marine products, 2) softening consumer end-markets, and 3) the timing of SeedBox sales in its food and beverage (“FNB”) markets. It also booked incremental sales of ~$9.3 million from its Mohawk Rubber acquisition within the distribution business. Management is eyeing a slight decline in FY’23 revenues, calling for $850—$860mm at the top line, on earnings of ~$1.73/share at the upper end of range. It also looks to invest $25–$30mm in CapEx by yearend.
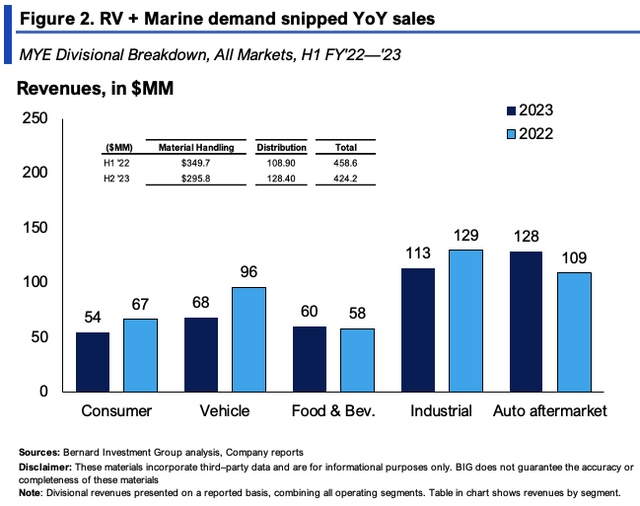
Speaking of the divisional takeouts (observed in Figure 2), the following highlights are relevant:
- The material handling segment, did $29.8 million of business, a 17.2% decline compared to last year. As mentioned earlier, lower sales in consumer vehicle and industrial end-markets was a major contributor to the downsides. In particular, demand for RV and maritime products has pared right back from ’22. The company said it was backfilling these market gaps with military and e-commerce sales. Still, across its core markets, industrials, vehicles and consumer markets showed notable weakness YoY, as seen in Figure 2.
- Distribution sales were underscored by the Mohawk acquisition as mentioned, and were up ~8.5% YoY to $128mm. The company also appointed its VP of sales/marketing, Jim Gurnee, to head up the distribution segment as well. Time will tell on the effectiveness of this move. Additional tailwinds potentially include structural changes from the electronification trends. Per the CEO on the call: “electric vehicle mandates because heavier EVs wear tires down at an accelerated pace compared to traditional internal combustion vehicles”. This is curious enough, and we’ll have to wait to see what specific impact this could have, but management are bullish on the distribution segment going forward.
BIG Insights
Investment activity and economic performance
Asset intensity has been creeping down for MYE over the last few periods. In Q2, working capital reduced 70bps YoY as a percent of sales, and it left the quarter on a leverage ratio of 0.9x (debt-to-adjusted EBITDA).
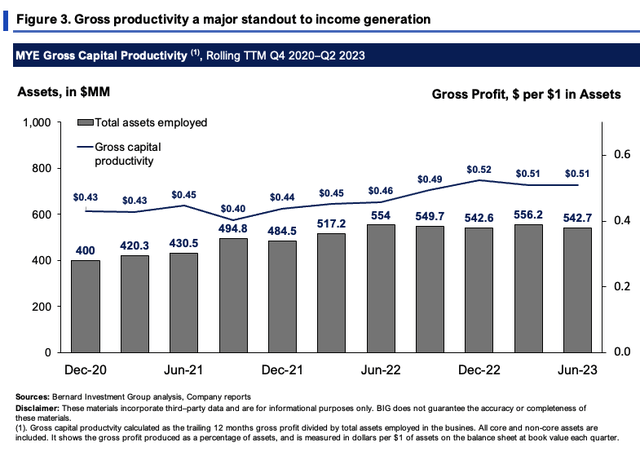
At the same time, productivity has been creeping higher. Figure 3 outlines this at the gross level. It shows the gross capital productivity produced on assets employed, by calculating the trailing 12 months gross profit divided by total assets. All core and non-core assets are included. Critically, asset density has grown $142mm these past 2.5 years. But MYE now rotates back $0.51 per $1 in assets employed, an increase of $0.08 on the dollar. For reference, a number above $0.3 is considered high.
Two identifiable factors underline these numbers in my view:
- MYE is reducing its total asset heaviness/footprint. It recently consolidated two of its moulding facilities into a single facility. This was in Northern Indiana. Net effect—reduced overhead, and a lower maintenance capital charge.
- Its 3-horizon strategy, that is exploring tactical M&A as a growth lever, rather than bringing additional tangible capital onto the balance sheet.
Both measures were brought online in 2020, and by this examination look to be adding incremental value so far.
BIG Insights
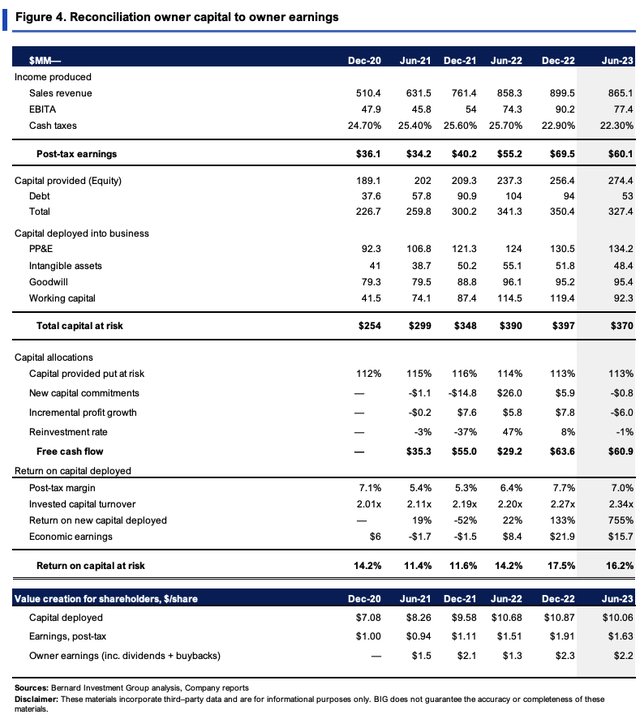
The earnings rate on capital deployed is also adding shareholder value. Figure 4 reconciles the owner capital to owner earnings in MYE’s business, exemplifying this. The company has put 113% of the $327mm of investor capital provided at risk in operations, around $10.05/share. It produced $60mm or $1.63/share in earnings after-tax on the $10.05/share, resulting in a 16% trailing return on investment by Q2.
Critically, these numbers have been stretching up since 2021, from ~11% to 16-17% last period. We use a 12% hurdle rate as the benchmark in our equity holdings. So the 4 point spread above this is considered ‘economic profit’ by this convention. These business returns are driven by capital turnover/efficiency, vs. growth at the margin. This squares off with the economics of the business. MYE’s products are hard to ‘differentiate’; thus, it is capital productivity that drives cash flows for the firm. Each turn in capital brought in $2.34 in sales last period, up from $2.00 in 2020. It also shows MYE is employing a cost leadership strategy in its pricing, offering its products at below industry rates. Again, this speaks to the economics of the business, and is a key driver of profitability and FCF going forward in my view.
These are perhaps the most crucial points in the investment debate here in my view. In the 12 months to Q2 FY’23, it had spun off $61mm in FCF, equating to $2.20/share to shareholders, including all dividends paid up.
BIG Insights
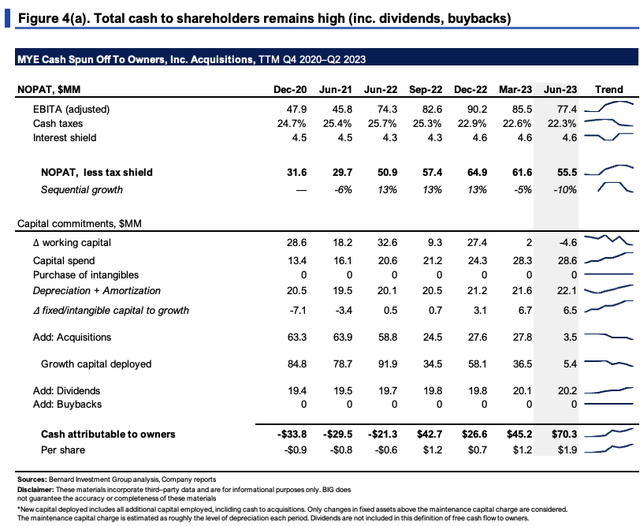
Figure 4(a) looks at MYE’s FCFs to owners from a different lens, including all acquisitions, dividends, and removing the tax shield in NOPAT. Only changes in fixed capital above the maintenance investment are considered as ‘growth investments’. The maintenance investment is approximated at the level of depreciation each period.
What’s evident—the company’s growth investment has increased from $0.5mm in Q2 ’22 to $6.5mm in Q2 ’23, whilst dividends made up ~28% of the cash distributed to shareholders last period. These aren’t unattractive economics at all in my opinion.
BIG Insights
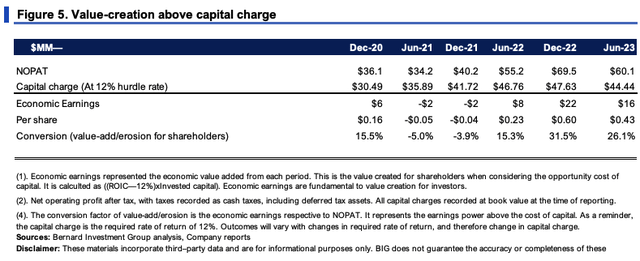
The benefits to MYE’s intrinsic value are quantified in Figure 5. It shows the economic earnings produced on MYE’s investments from 2020–2023, rolling TTM basis. The capital charge is taken as 12% of the capital deployed each period (12% being the hurdle rate used here). Only that NOPAT above the capital charge is considered economic earnings, those below, economic losses. We are most interested in economic earnings, as they are fundamental in the value creation for equity holders In other words, we want as much post-tax profit to be above this 12% hurdle rate as possible. The conversion factor illustrates the percentage of economic profit/losses pulled from NOPAT each rolling TTM period.
It’s from 2022 onward we see the best economic performance from MYE. The company added a range of $0.23—$0.60 in economic earnings per share during this time, converting 15–31% of NOPAT in doing so.
BIG Insights
Figures 3 to 5 show the economic performance to date. It matters most what the expectations are going forward.
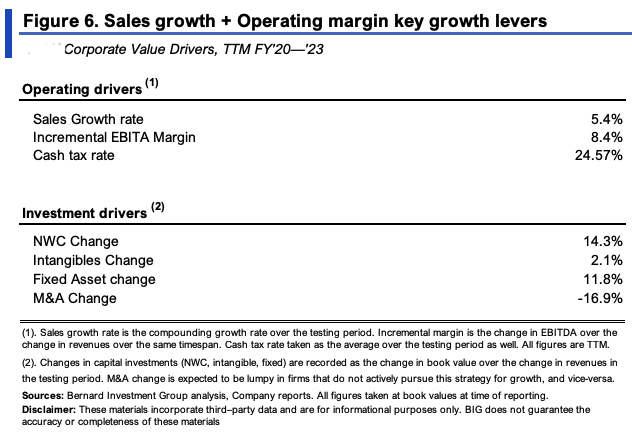
To that point, Figure 6 illustrates the value drivers of MYE’s financial and economic growth over the last 3 years. Operating drivers (sales growth rate, incremental operating margin, cash taxes) are central to incremental earnings after tax. Investment drivers illustrate the change in investment with respect to the change in sales, and round out FCF.
BIG Insights
Since 2020 sales have grown at 5.4% each period, whilst operating margins have been stable and averaged ~8.4%. Each new $1 in sales required an additional $0.28 investment, $0.12 of this towards fixed capital. Meanwhile, each turn in sales saw $0.143 in additional NWC requirements.
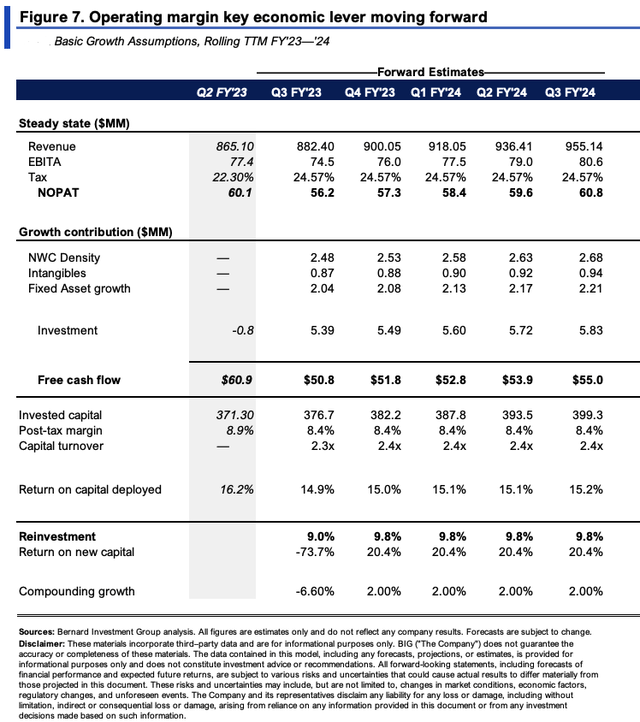
We can make some implicit assumptions on what this means for MYE going forward. Say it continues at its steady-state of operations, we might see a picture similar to Figure 7. A 2% revenue growth rate is instead used going forward. Critically:
- It could spin off $50-$55mm in FCF each rolling TTM period, from ~$60mm in NOPAT and $5–$6mm investment ($30–$40mm all up). Acquisitions are excluded from this.
- Capital turnover could remain at 2.3–2.4x of sales, with the firm reinvesting ~9–10% of earnings each period.
- This could produce ~15% return on existing capital, and compound the firm’s intrinsic value at ~2% on average into 2024.
All up, you’d be looking at ~8% growth in intrinsic value the coming periods, should this steady-state hold with no perturbations.
BIG Insights
Valuation and conclusion
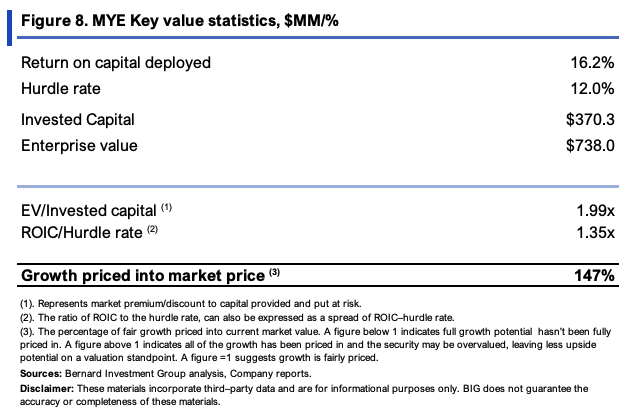
The stock sells at 11x forward earnings and 8.6x forward EBIT, quite cheap on absolute values in my opinion. You’re getting a 14% cash flow yield on this as well. The market has also priced the company for minimal growth going forward, at an EV/IC of 2x compared to what it’s producing on capital deployed. In fact, the market has already priced in almost 150% of the growth numbers at these stipulations, as seen in Figure 8. This could be a risk in my view, but a more thoughtful analysis is required.
BIG Insights
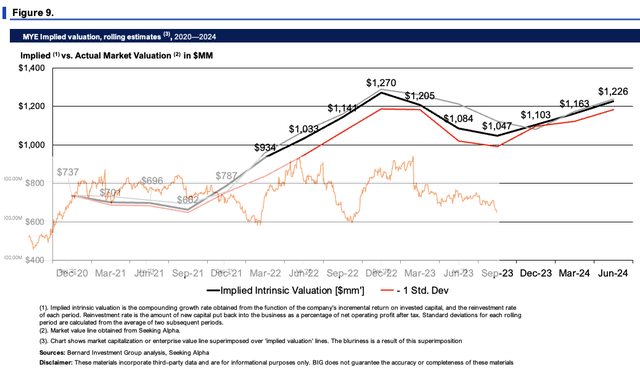
Figure 9, spread out over the 2 images below, implements the company’s value-creation machine into an implied market value. Forecasting out to ’28 at the steady-state outlined earlier, and discounting back at our 12% hurdle rate, prices the company at $24/share, or 17x forward FCF. You get to $28 compounding the current share price at the function of its ROIC and reinvestment rate.

BIG Insights
This is shown graphically below, comparing the implied intrinsic value to the current equity line. In my view, MYE is undervalued and this could prove to be a catalyst to see it sell higher into FY’24.
BIG Insights
In short, given the combination of:
- A new growth strategy (the 3 horizon strategy);
- Robust economic characteristics that are (a) growing FCFs to reinvest, and (b) recycling capital back into the business at attractive rates of return;
- Compressed multiples;
MYE appears undervalued in my opinion. The factors outlined here culminate to suggest MYE could be worth more than where it sells today. This report goes into detail on the economic performance to date, and what’s needed to see MYE sell higher into the future. My rating is a buy, eyeing $24/share as the next price objective. Net-net, rate buy
Read the full article here


