Financial theory suggests that there is a limit to how high passive investing can get as a percentage of total investing before it breaks the market, but no one knows exactly where that threshold is.
Meanwhile, passive share (the percentage of assets invested passively) continues to set all-time highs, inching ever closer to that dangerous point. This article will discuss the extent of passive investing, how it could break the market, and some early warning signs that it is starting to strain the market.
How high is passive share?
CNBC, citing Morningstar research spots passive share at just over 50% with $13.29T of passive compared to $13.23T active.
“The total assets under management in exchange-traded funds and notes along with passively managed mutual funds reached a combined $13.29 trillion at the end of December, nudging above the $13.23 trillion held in active assets.”
Bloomberg spots passive share at 53.8% of U.S. funds.
Bloomberg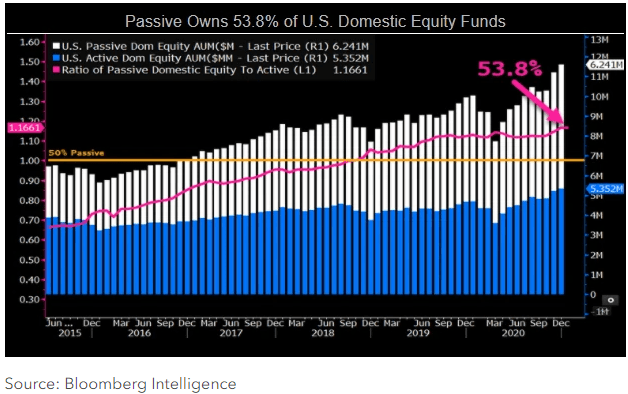
Note that in both instances they are looking at managed assets which are where there is greatest visibility because these managed vehicles are labeled as either being active or passive.
There is quite a bit of capital in the market that is unclassified. Consider an individual investor who has a handful of stocks bought 20 years ago. Is that active or passive?
Presumably those stocks were initially chosen for reasons which mean they were actively selected, but 20 years later those reasons may no longer exist. Thus, it is unclear how to classify this sort of capital.
One potential way to measure passive share is to look at the percentage of capital that follows indices. This study took a look at the volume of trading that took place when indices rebalanced.
research report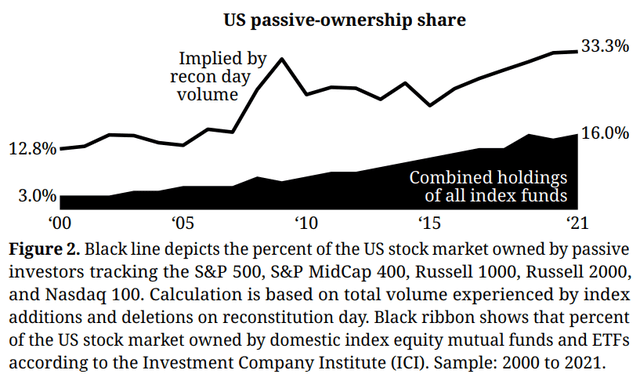
Based on the volume of transactions that automatically happened when indices were rebalanced, it estimated 33% of overall capital is in some sort of index tracking vehicle, which by definition would be passive capital.
Passive share has, of course, risen since then, with substantial inflows into ETFs. Index funds are also only one type of passive investment. As such, I think the Bloomberg and Morningstar estimates are probably quite close to the overall number, with a passive share somewhere between 50% and 55%.
How does too high of a passive share break the market?
Price discovery is the mechanism by which market price moves toward the weighted average estimate of market participants.
In a properly functioning market, the stock price is a function of how traders view a stock and the price will move to a point where there is balance. If more traders are bullish than bearish at a given price point, the stock will rise until there is an equilibrium.
The mechanism by which this works is that price influences one’s buy decision. One might like a given stock at $15 per share but not like it enough to buy it at $17.
Elasticity is the key to price discovery.
ETFs and other passive investment vehicles are inherently not price sensitive. Or put in more economic terms, they are inelastic sources of demand.
When most of the market is active, price discovery works while ETFs and other passive investments get to hitch a free ride on the coattails of active investors.
The open question is how many passive investors can ride on a shrinking pool of active investors before price discovery breaks?
Well, there is lumpiness in where the passive share is most prevalent. So while it is just over 50% of the overall market, it might be 30% in some areas and 70% in others.
Thus, we can get a sense of early signs of breaking by looking at the areas in which passive share is the highest.
- Passive share is highest in U.S. equities.
- Within U.S. equities, passive share is highest in real estate.
ETF.com reports:
“Real estate is the most passively owned sector, while communication services are the least.”
Thus, the U.S. REIT sector is a good place to look for signs of breakage. I believe some of the breaking is already happening.
Breaking is different than being wrong
Allow me to clarify specifically what I mean by market breaking.
If we look back to 2019, most REIT market participants were bullish on the office. The market correctly priced that in by the office REITs trading at fairly high AFFO multiples (cashflow equivalent for REITs).
Clearly, the market got it wrong, as the office has since struggled with vacancy, but getting it wrong is not a breaking of the market. The market worked in that the market prices correctly reflected the views of the market participants.
A market breaking would be where stock prices no longer reflect the views of investors. I believe that is happening presently in a few areas within REITs. I think Kimco Realty Corporation (KIM) is a clear example of the market price not reflecting the views of investors.
Shopping center fundamentals have changed materially in the last 2 years. Back in 2022, there were significant concerns about tenants closing stores and there did not seem to be much demand for big-box locations.
Since then, fundamentals have improved across the board. Demand for shopping center space blossomed with occupancy broadly increasing to what is now approaching record highs. Rental rates have improved to what is also approaching record highs. Industry analysts such as Marcus and Millichap and Yardi Matrix anticipate demand growth continuing to outpace supply growth in shopping centers ushering in what appears to be a secular growth phase for shopping center landlords.
There seems to be very little dissent among analysts. Shopping centers are almost universally viewed more strongly now than they were 2 years ago. Yet this is what has happened to Kimco’s market price.
S&P Global Market Intelligence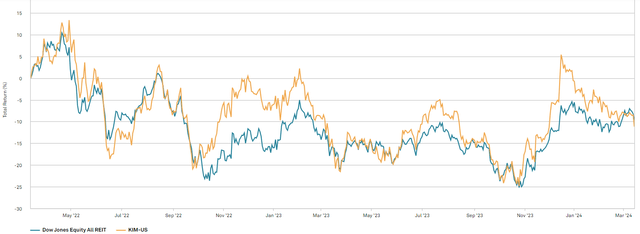
It has moved almost in lockstep with the REIT index.
With its fundamentals being so differentiated, it should have moved differently than the index which is only a very small percent shopping centers.
This is what I mean by a market breaking. The market price is not reflecting the views of investors.
As you know, I am quite bullish on Kimco and have written articles on the merits of shopping centers.
So while I believe that KIM is worth substantially more than its market price, my views on KIM and on the shopping center sector are not all that different from the views of other investors and analysts.
20 Wall Street analysts cover Kimco with a consensus rating of outperform.
S&P Global Market Intelligence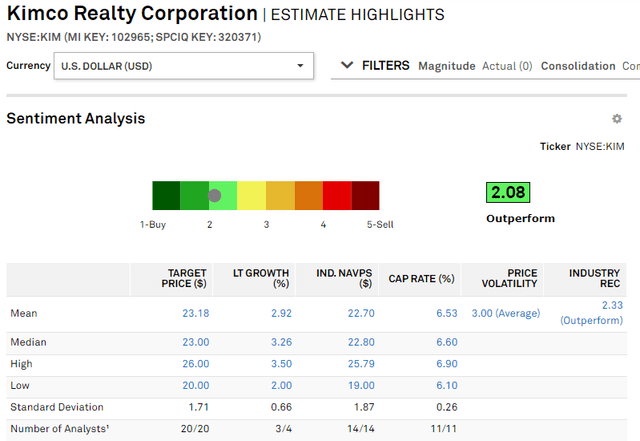
The lowest price target among all 20 is $20 per share, which is still well above the current $18.65.
The private market also really likes shopping centers. Properties similar to those in KIM’s portfolio are transacting at 5.5%-6% cap rates.
Yet Kimco is trading at a roughly 7% implied cap rate.
S&P Global Market Intelligence
Its properties in the private market are worth $23.30-$26.47 based on the level of NOI they produce and comparable recent transactions.
Kimco has long been regarded as a well-managed company and has a great balance sheet, so there is no apparent reason that it would trade at such a discount to its assets.
So, if seemingly most investors and analysts are bullish on KIM, why is it not reflected in the market price?
I posit that passive share has gotten sufficiently large that it is interfering with price discovery. Kimco’s largest investors are passive. Vanguard and BlackRock hold nearly 25% of KIM’s outstanding stock.
S&P Global Market Intelligence
These are just 2 of the many passive vehicles owning KIM.
As a long-standing and large-cap REIT, KIM is in nearly every REIT ETF and REIT index as well as being in most of the REIT mutual funds.
With so much passive investment in KIM, its trading is potentially being overwhelmed by the inflows and outflows of the various passive instruments. This might be why KIM’s price movement is so correlated with the price movement of the REIT index.
Someone might sell the Vanguard Real Estate Index Fund ETF Shares (VNQ) after hearing a negative report on the state of commercial real estate (meaning office), and in so doing they are also selling shares of KIM.
Thus, due to really high passive share, it is actually possible for KIM to trade down even in the absence of bearishness on KIM.
Price discovery may indeed be broken or at least impaired.
We have observed similar odd market behavior in many other REITs where they will come out with huge earnings reports and the stock seems completely unresponsive to the news.
After Flagship Communities Real Estate Investment Trust (OTCPK:MHCUF) reported a 23% growth quarter on 3/14/24, the stock was basically flat on 3/15/24.
SA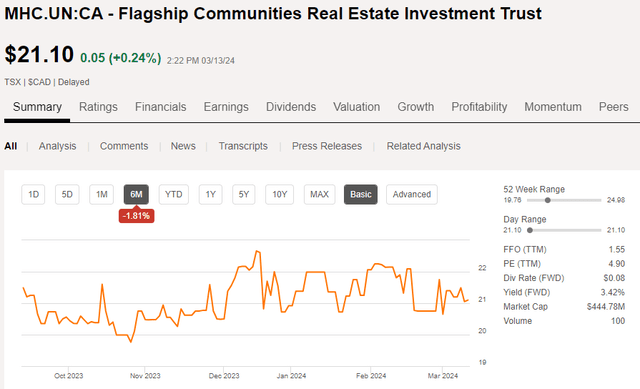
In this case, the company is too small to be in most ETFs, it is more just a paucity of active investment in the REIT space as evinced by only 100 shares trading hands after earnings. It is a somewhat small company, but it is not THAT small. Volume this low is not normal.
How to trade in a potentially broken market
What is happening in REITs right now is that company-specific fundamentals are not being fully reflected in market prices. This presents 2 types of actions in which an investor can profit from the market’s inefficiency:
- Buying REITs where the underlying fundamental strength of recent periods has not been priced in.
- Selling REITs where the underlying weakness of recent periods has not been priced in.
It is an odd time to trade.
Normally, to get an advantage, one has to be better than most at predicting what will happen to fundamentals. Today, with the market not responding properly, one can actually wait for the fundamentals to happen and still often be able to get in or out at the pre-announcement price.
For example, if one was uncertain about how Flagship would perform in the quarter, they could have waited until after reading the report and still been able to buy at roughly the same price (assuming there were shares to buy)
The downside of the unresponsive market is that it might take longer for fundamental winners to translate into capital gains, but for those who have the means and the patience to wait this market looks quite rewarding.
Editor’s Note: This article discusses one or more securities that do not trade on a major U.S. exchange. Please be aware of the risks associated with these stocks.
Read the full article here


