By Valuentum Analysts
It’s hard for us to really pin down what has gone wrong with PayPal (NASDAQ:PYPL) and the financial technology “fintech” space, more generally, during the past 12-18 months. After all, we viewed many in the fintech space similar to the likes of Visa (V) and Mastercard (MA), both of which are still enjoying strong financials and share-price performance. The story with PayPal has become a much different one than those two credit-card giants. Back in September 2021 near the prior stock market peak, we were extremely bullish on PayPal’s prospects. We loved the stock in this article. Within our valuation infrastructure, we were building in strong top-line growth and considerable margin expansion, as we expected trends at the time to persist. But then, our thesis fell apart, and in our latest update in July 2022, we explained why PayPal had become a “show-me” story, meaning that we no longer would build in optimistic expectations. Since mid-2022, PayPal’s shares have continued to languish.
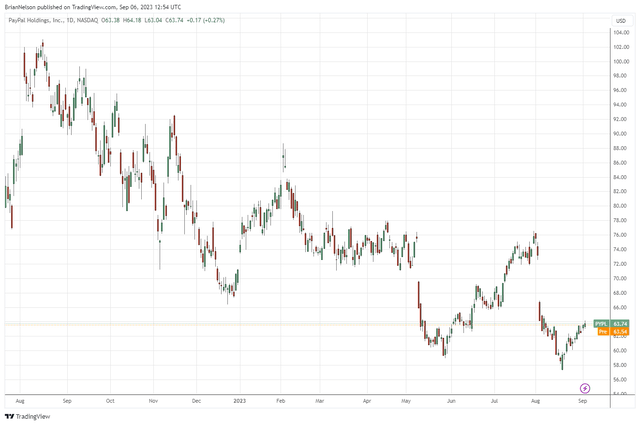
PayPal’s shares have continued to tumble since our latest update. (Trading View)
The problem with the PayPal investment idea consideration months ago, in our view, was that there really wasn’t anything that could have warned investors of the massive change in the trajectory of its future expected financials 12-18 months ago. Of course there was the Bloomberg report in October 2021 that noted the company was exploring a purchase of Pinterest (PINS), and this was a red flag that indicated fundamentals may not be delivering on management’s expectations, but what drove those weakening fundamentals to the current large degree remains a big question mark to us. Sure, one might have expected some weakness during the market drawdown in 2022 as consumers faced inflationary pressures, but the change in our long-term outlook of PayPal has been quite pronounced.
Consumer sentiment surrounding PayPal isn’t all that great either based on our experience, and this is something we have trouble understanding. At the end of the day, the company is a payment processer, so the preference of many to prefer to process their payments on other platforms than PayPal just doesn’t make a lot of sense to us. We’ve witnessed how consumer sentiment can really impact the fundamentals of names such as Target (TGT) and Anheuser-Busch InBev (BUD), but we just can’t put our finger on why many care so much about not paying through PayPal. We’d love to hear your thoughts in the comments section on this topic. From our perspective, payment processing is largely a commodity so shouldn’t cost and ease of use be pretty much the primary considerations?
Clearly, we’re not happy with how PayPal’s stock has performed, and we remain puzzled on the main drivers behind PayPal’s fall from grace. Aside from increased competition in the fintech arena coupled with the fall in crypto prices, we’d be speculating if we were to come up with more than that. It’s possible some may question management, but the firm is still a tremendous free cash flow generator, and it’s just hard to find fault with that. With all of this in mind, we don’t think we would ever consider PayPal again in any of our newsletter portfolios. Quite simply, if we don’t know exactly how the company went wrong in the past, we’d be hard pressed to say that the company won’t succumb to the same dynamics that have punished its shares again. We continue to learn from our miscues, and PayPal has been one of them.
In this note, we wanted to update readers on our new discounted cash-flow based fair value estimate of PayPal and reiterate that the firm remains a “show-me” story. For those that don’t know PayPal, the firm was spun off from eBay (EBAY) in July 2015 and operates as a technology platform company that enables digital and mobile payments on behalf of consumers and merchants worldwide. Its platform allows customers to pay and get paid, transfer and withdraw funds to their bank accounts, and hold balances in their PayPal accounts in various currencies. PayPal is constantly innovating and updating its products and platform to remain competitive. Venmo, its peer-to-peer platform, offers additional growth potential, and management is optimistic regarding its ability to further monetize the platform.
As with other companies in the payments space, PayPal’s business is subject to extensive government regulation and oversight, as well as complex, overlapping and frequently changing rules, regulations and legal interpretations. Any factors that increase the costs of cross-border trade or restrict, delay, or make cross-border trade more difficult could harm its business, providing additional geopolitical risk. PayPal may be setting itself up for long-term success, but we’ve grown more skeptical in recent months. Competition is growing for PayPal, including the likes of Block’s (SQ) Square, Stripe, and digital initiatives from credit card companies. PayPal continues to be a tremendous free cash flow generator with a strong balance sheet, but readers should remain cautious, in our view.
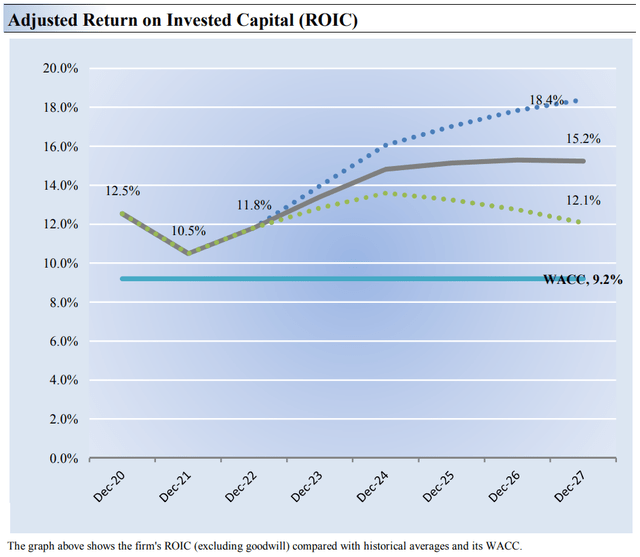
PayPal remains an economic-value generator. (Valuentum)
As is commonly accepted, the best measure of a company’s ability to create value for shareholders is expressed by comparing its return on invested capital [ROIC] with its weighted average cost of capital (WACC). The gap or difference between ROIC and WACC is called the company’s economic profit spread. PayPal’s 3-year historical return on invested capital (without goodwill) is 11.6%, which is above the estimate of its cost of capital of 9.2%. As such, we assign the firm a ValueCreation rating of GOOD. In the chart above, we show the probable path of ROIC in the years ahead based on the estimated volatility of key drivers behind the measure. The solid grey line reflects the most likely outcome, in our opinion, and represents the scenario that results in our fair value estimate.
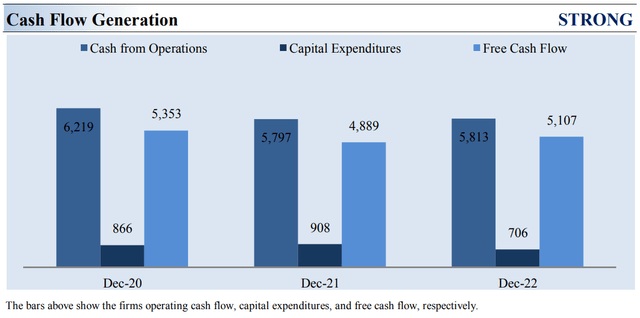
PayPal’s free cash flow generation has been strong. (Valuentum)
Stocks that generate a free cash flow margin (free cash flow divided by total revenue) above 5% are usually considered cash cows. PayPal’s free cash flow margin has averaged about 20.9% during the past 3 years. Frankly, this is awesome, and as such, we rate PayPal’s cash flow generation as STRONG. The free cash flow measure shown above is derived by taking cash flow from operations less capital expenditures and differs from enterprise free cash flow [FCFF], which we use in deriving our fair value estimate for the company. At PayPal, cash flow from operations decreased about 7% from levels registered two years ago, while capital expenditures fell about 18% over the same time period.
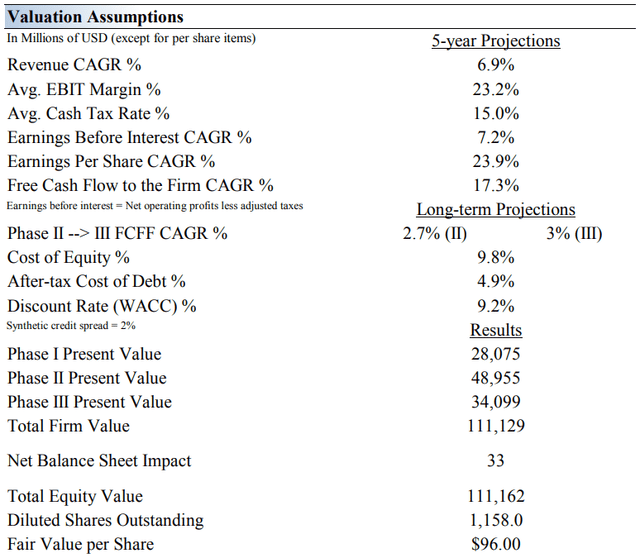
Our summary assumptions to arrive at PayPal’s fair value estimate. (Valuentum)
We now think PayPal is worth $96 per share, a far cry from the fair value estimate we had just a couple years ago. The biggest change within our valuation infrastructure from the more optimistic assumptions of years past, of course, are lower intermediate revenue growth and operating-margin assumptions. PayPal’s business growth seemed like it hit a wall during 2022, all the while it became incrementally more expensive to attract new customers, pressuring both expectations in top-line expansion and mid-cycle operating margins. Obviously, the changes in our future forecasts weren’t something that we weren’t anticipating, and based on how the share price has reacted since the beginning of 2022, the market wasn’t expecting such a dramatic change in the company’s outlook either.
As for some of the summary assumptions of our discounted cash flow model, our near-term operating forecasts, including revenue and earnings, do not differ much from consensus estimates or management guidance. Quite simply, the next couple years don’t matter much when it comes to the composition of intrinsic value, so modest beats and misses in any given quarter don’t drive many fair value revisions. What does drive big changes in our valuation model is changes in mid-cycle expectations (these changes are actually the big drivers behind big share-price changes when a company beats or misses a quarter, or issues a change in forward guidance; it is not actually the quarter, itself, that matters). In the image that follows, one can see that the present value of discounted cash flows between Year 6-20 account for the largest percentage of the company’s intrinsic value. Changes in mid-cycle expectations tend to be the biggest drivers behind price and fair value revisions, and PayPal is no exception.
On that note, our valuation model now reflects a compound annual revenue growth rate of 6.9% during the next five years (was 12.5% in our latest update on Seeking Alpha), a pace that is lower than the firm’s 3-year historical compound annual growth rate of 15.7%. We think a mid-to-high single-digit revenue growth rate makes a lot sense these days at PayPal, but again, we remain cautious, and we’ll talk about the importance of a fair value estimate range in this note, too. Our model reflects a 5-year projected average operating margin of 23.2%, which is above PayPal’s trailing 3-year average (but still below levels we had been expecting in late 2021). We still expect some margin improvement at PayPal, but nowhere near as much as we had thought. Beyond year 5, we assume free cash flow will grow at an annual rate of 2.7% for the next 15 years and 3% in perpetuity (we use a standard 3% growth rate across our coverage for the perpetuity function). For PayPal, we use a 9.2% weighted average cost of capital to discount future free cash flows.
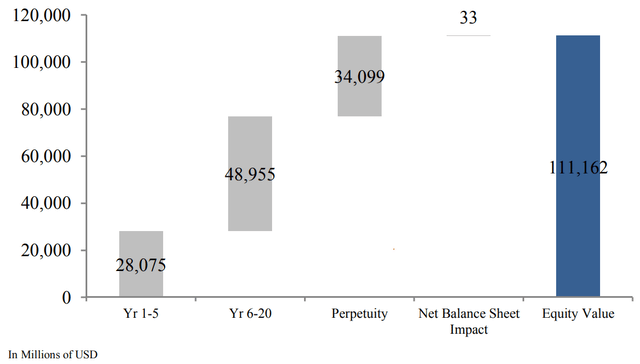
The build-up and break down to equity value of PayPal. (Valuentum)
In the chart above, we show the build up to our estimate of total enterprise value for PayPal and the break down to the firm’s total equity value, which we estimate to be about ~$111.16 billion. PayPal’s market capitalization currently stands at ~$70 billion. The present value of the enterprise free cash flows generated during each phase of our model and the net balance sheet impact is displayed above. We divide total equity value by diluted shares outstanding to arrive at our $96 per share fair value estimate.
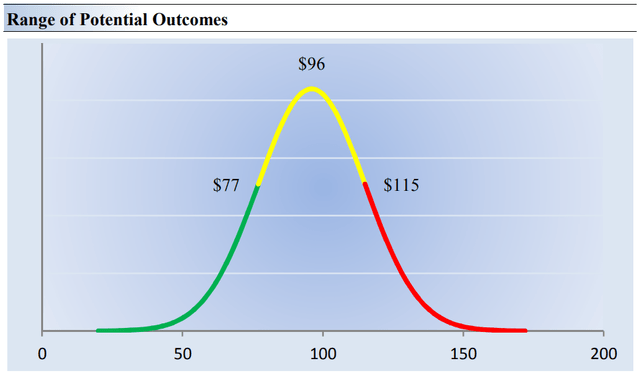
Our fair value estimate range of PayPal. (Valuentum)
Our discounted cash flow process values each company on the basis of the present value of all future free cash flows. Though we estimate PayPal’s fair value at about $96 per share, every company has a range of probable fair values that’s created by the uncertainty of key valuation drivers (like future revenue or earnings, for example). After all, if the future were known with certainty, we wouldn’t see much volatility in the markets as stocks would trade precisely at their known fair values. Our ValueRisk rating sets the margin of safety or the fair value range we assign to each stock.
In the graph above, we show this probable range of fair values for PayPal. We think the firm is attractive below $77 per share (the green line), but quite expensive above $115 per share (the red line). The prices that fall along the yellow line, which includes our fair value estimate, represent a reasonable valuation for the firm, in our opinion. Shares of PayPal look cheap, but again, we have been wrong on this name, and we can’t help but feel that there is more at work to this story than we can capture within our valuation infrastructure.
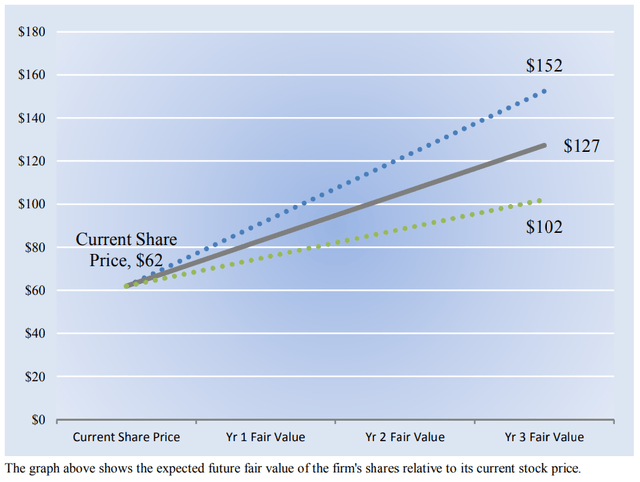
Our thoughts on how PayPal’s equity value may advance in coming years. (Valuentum)
We estimate PayPal’s fair value at this point in time to be about $96 per share. As time passes, however, companies generate cash flow and pay out cash to shareholders in the form of dividends. The chart to the right compares the firm’s current share price with the path of PayPal’s expected equity value per share over the next three years, assuming our long-term projections prove accurate. The range between the resulting downside fair value and upside fair value in Year 3 represents our best estimate of the value of the firm’s shares three years hence.
This range of potential outcomes is also subject to change over time, should our views on the firm’s future cash flow potential change. The expected fair value of $127 per share in Year 3 represents our existing fair value per share of $96 increased at an annual rate of the firm’s cost of equity less its dividend yield. The upside and downside ranges are derived in the same way, but from the upper and lower bounds of our fair value estimate range. PayPal’s shares look like they have considerable upside, but there are risks to the story that keep us on the sidelines with respect to the newsletter portfolios. A few of our favorite ideas that we like more than PayPal can be found in this article.
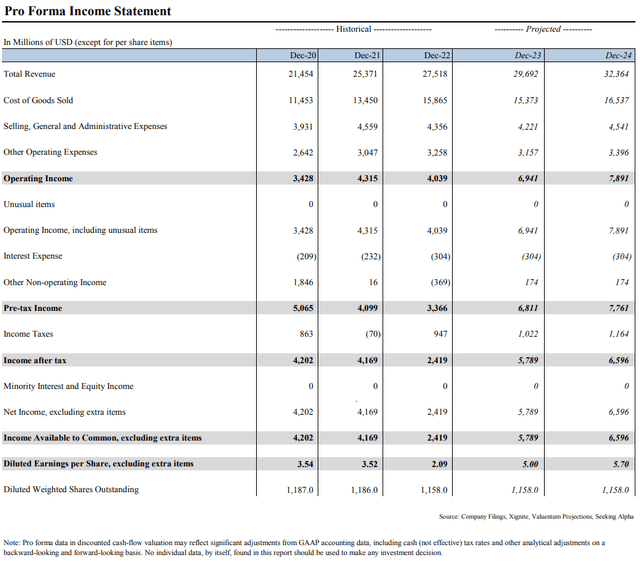
Pro Forma Income Statement (Valuentum)
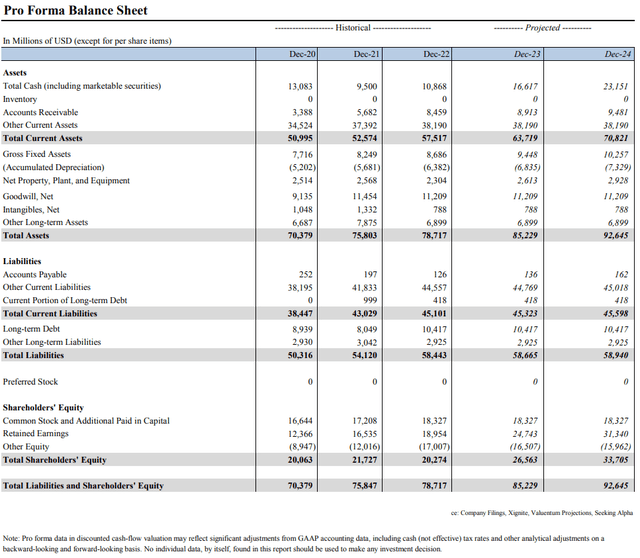
Pro Forma Balance Sheet (Valuentum)
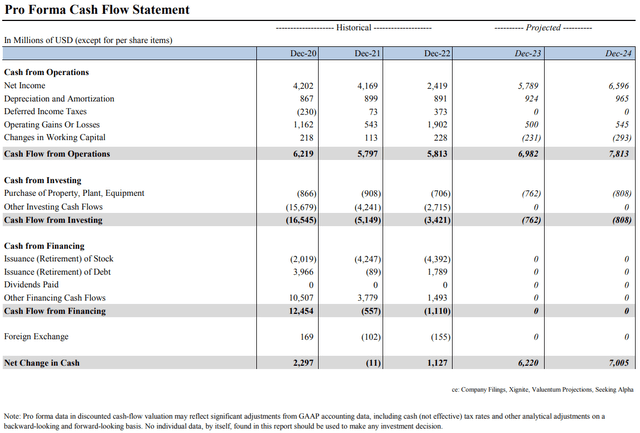
Cash Flow Statement (Valuentum)
Read the full article here


