By Patricia Healy, CFA
The second quarter of the year saw fears of banking contagion abate, the continuation of Fed rate hikes to battle inflation, and concern about recession. Consumer purchases and job growth continued to be positive, which fueled the expectation of further Fed rate hikes. Continued economic growth despite the rate hikes led to a resumption of growth in the stock market. The surfacing of AI through Chat GPT and other applications as well as examples of AI that have already been in use led to expectations of productivity gains despite layoffs in technology jobs, though new AI jobs have also fueled the market and employment recently. Recessionary outlook has waned or possibly been pushed out, and estimations of severity have lessened. See our 2023 mid-year markets outlook.
Municipalities continue to be challenged by an array of longer-term pressures: pension funding needs as some play catch-up, fewer workers supporting a larger retired employee population, demographic changes, the energy transition, and the challenge of developing resilience to climate change and more-extreme weather. Shorter term, there is the winding down of pandemic aid and, for some, dependence on volatile taxes and/or fees, such as in CA and NY. Job tightness has challenged the ability of munis to provide services, including timely reporting of financial results at the same time regulators are requiring more detailed and consistent reporting.
Most municipalities remain well positioned to address these challenges with large reserves, better budgeting, and continued economic growth.
Municipalities increasingly have sustainability officers, who generally span departments and try to coordinate all areas of municipal management, not just environmental, from the finance department to infrastructure development, including climate mitigation, with long-term sustainability of the entity in mind. The vernacular increasingly emphasizes sustainability rather than ESG (environmental, social and governance) – see here. Larger and more diverse municipalities are generally better equipped to have this type of management, while smaller issuers may rely on some state resources.
The remainder of this commentary discusses state rating changes, including California’s change in trend to negative; S&P’s report on city economic activity and the effect of office space occupancy on muni credit quality; and Moody’s annual default study (with charts), which continues to show that muni default rates are very low and below global corporate bond default rates.
Rating Actions
While final tallies have not been released for the quarter, anecdotally, US public finance upgrades outpaced downgrades, except for healthcare. This continues a trend from 2022. S&P reported in its annual rating transition report that, over the past 12 quarters, US public finance has averaged 144 upgrades and 130 downgrades, with eight straight quarters of improving credit quality, following the four quarters at the height of the pandemic when downgrades averaged 247 per quarter, to 40 upgrades.
We report on state ratings because a state’s financial health has trickle-down effects, both positive and negative, for localities in the state. The largest expenses for states are K-12 education and healthcare; however, budgets for housing agencies and higher education as well as infrastructure can rise or fall depending on a state’s fiscal health and budgeting practices.
Kentucky Upgrades
S&P and Fitch both upgraded the state’s rating in Q2, S&P to A+ from A and Fitch to AA from AA-, reflecting strengthened budgetary flexibility and long-term financial stability, which is expected to continue in the current and future budget cycles. Kentucky has also seen a post-pandemic surge in tax collections, now in its third year. Moody’s Investors Service rates Kentucky Aa3, and Kroll Bond Rating Agency rates it AA-minus. Both agencies have stable outlooks on the state. The average rating for states is AA, with a number rated AAA. Only four are rated in the A category by at least one rating agency. Since Illinois received upgrades, there have been no states in the BBB category or below.
New Jersey and Massachusetts were upgraded by S&P in April 2023, and we reported on them in our Q1 credit commentary.
California Outlook to Negative by Moody’s
Moody’s change in outlook to negative from stable on the State of California’s Aa2 rating was based on the weakened and uncertain revenue environment in California, which raises the possibility of extended pressure on the state’s budget. Moody’s notes that the revenue decline in fiscal 2023, estimated at $31 billion as of the May, is much larger than that of any other state – a consequence of the state’s high exposure to capital gains tax, reliance on income taxes from high earners, and a delay in the tax filing deadline to October. (The state’s revenue decline would be lower when adjusted for its forecast of $40 billion in deferred revenue.) California is a massive state whose GDP would make it the fifth-largest economy in the world. Depending on deferred revenue collected and how the financial markets perform (which affects tax collections), the state’s fortunes could improve or decline further. While the state has substantial reserves, it is looking at budget adjustments so as not to draw down reserves. Credit analysts and investors view these actions positively, and the actions can contribute to long-term sustainability.
Bay Area Rapid Transit (BART) received a two-notch downgrade by S&P to A+ from AA and a continued negative outlook due to reduced ridership, projected deficits, large financing needs, and dependence on state and federal transportation funding. In July, Moody’s assigned a negative outlook to BART’s Aaa rating for the same reasons. Fitch also has a negative outlook on BART’s AAA rating. The security for the bonds is the unlimited general obligation of the three highly rated counties in the San Francisco Bay Area that BART serves, as well as structural features which lock up revenues to pay debt service. The divergence in ratings between S&P’s A+, and Moody’s Aaa and Fitch’s AAA, reflects the methodology used by the respective agencies and the assumptions employed. BART also issues bonds secured by sales taxes which are rated AA+ by S&P with a negative outlook, AA by Fitch and not rated by Moody’s.
Just as prospects for a recession are changing, so are WFH (work from home) and RTO (return to work) requirements. In a recent report, Barclays noted that in the second quarter, demand for office space in San Francisco grew about 10% from Q1, according to a report from commercial real estate technology firm VTS. VTS said that prospective tenants have been looking for spaces of more than 50,000 square feet since March. The demand has been driven largely by the boom in artificial intelligence companies.
S&P on Office Real Estate
S&P in a recent report paints a gloomy but not hopeless picture. We remind readers that this is the outlook for office real estate including retail shops in those office buildings, while industrial real estate is faring better. S&P notes that large US cities face a looming trifecta of pressures stemming from remote work: falling commercial property valuations, the potential for weaker tax collections in urban cores, and struggling public transit systems. Despite the challenges facing commercial real estate due to RTO trends, S&P does not expect a broad-based decline in general-obligation credit quality among large US cities with strong credit characteristics. The pace of downtown recovery is not following a one-size-fits-all formula: Factors such as location, local unemployment, industry composition, and commute times point to different cities having markedly different recovery paths. S&P cites a University of Toronto study that uses cellphone data to estimate a city’s recovery. This data shows that San Francisco has recovered only 32% of pre-pandemic activity, while New York City has recovered 75% and Miami is at the median with 63% recovery in activity. While this measure is not the only measure of return to work, it does show relative pick-up in activity – and these cities also have a tourist component. S&P does expect increased vacancy rates through 2024 as office leases expire, especially for older buildings.
Moody’s Releases Its Annual US Default Study for 1970-2022
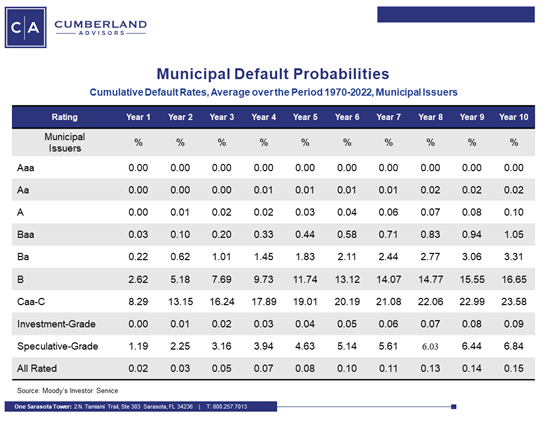
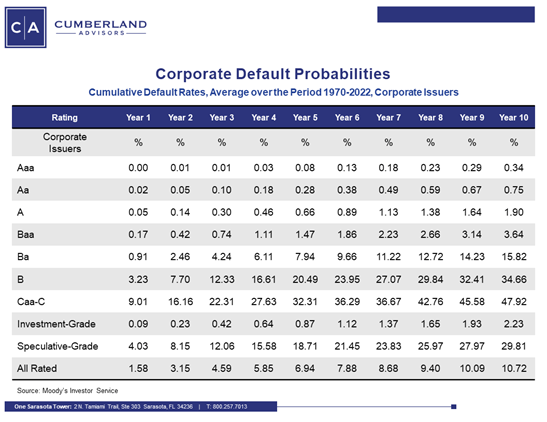
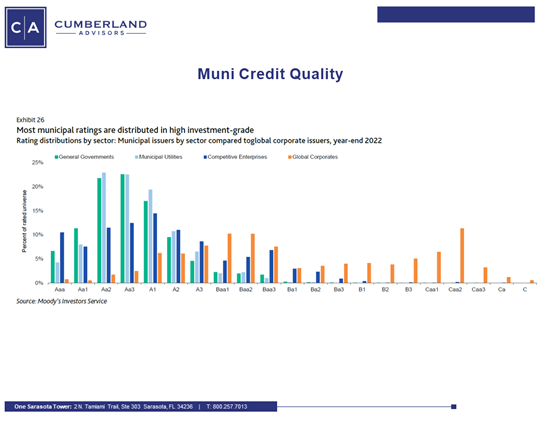
Each year, we await the Moody’s default study showing the low default risk of rated municipal bonds (Chart 1 below) compared with global corporate bonds (Chart 2), and the relative credit quality of muni bonds compared with global corporate bonds (Chart 3).
The first chart shows the very low default rate of all muni bonds, just 0.15% over a 10-year period, while investment-grade munis experienced an even lower rate of 0.09%. This compares to a global corporate default rate of 10.72% and an IG rate of 2.23%.

Moody’s Investors Service

Moody’s Investors Service
The majority of muni bonds in the Moody’s study have an average rating of Aa3, while global corporates average Baa3. The muni bonds are somewhat evenly distributed around AA, while corporate bonds are a bit more lumpy, with many rated A3 to BBB- and some also in the CCC category. Even competitive municipal enterprises such as airports have much higher ratings than corporate bonds do.
The Moody’s study shows that municipal ratings and corporate ratings moved in different directions, as the municipal sector generally continued to see ratings drift up. Moody’s notes that in 2022 the one-year rating drift was two notches per 100 credits for municipals as upgrades again outpaced downgrades, while the rating drift for global corporates was down nine notches per 100 credits. However, within the municipal sector, rating drift turned negative for competitive enterprises (including hospitals and private higher ed) in 2022 after a year of generally positive drift.

Moody’s Investors Service
Original Post
Editor’s Note: The summary bullets for this article were chosen by Seeking Alpha editors.
Read the full article here


