The 10-Second Thesis
Rollins (NYSE:ROL) is one of those rare companies that tick almost all the boxes I like in an ideal investment. Top and bottom lines growing, high and consistent Return On Invested Capital (ROIC), low debt, no shareholder dilution, and all of this is supported by a high level of predictability. These companies tend to trade at a premium and Rollins is no exception here with a TTM PE ratio of 41.8 and a Price to FCF ratio of 34.0. Skipping the multiples for a second, these characteristics give me a sense of security when investing, even when I don’t fully understand the business. That is not a problem here though. They provide pest control services and I am pretty sure I do not need to explain the nuts and bolts of what that is. Therefore, sign me up, right? Well, put my name on the waiting list for now. I am excited by what I see but with an estimated 6.3% CAGR for the global pest control market in the next 4 years, I cannot digest the multiples the company is currently trading at. I will be waiting for a better price for the time being.
Predictable Cash Flows
Rollins puts the largest companies in the S&P500 to shame when it comes to cash flow predictability. Figure 1 below is a bit of a spider web, but it shows how consistent and predictable the company really is compared to the known heavyweights. The free cash flow is consistently around 118% of net income and only in 2020 it significantly deviated from that. I narrowed the y-axis to the 90% to 130% interval, and no other company stays within that range in as consistent a manner as Rollins, Paychex (PAYX), and ADP (ADP). I added Paychex and ADP because these are two of the most consistent companies when it comes to this ratio.

Figure 1: Free Cash Flow to Net Income (Author)
On a quarterly basis, this and the free cash flow to EBITDA ratios, are as predictable as clockwork (Figure 2).
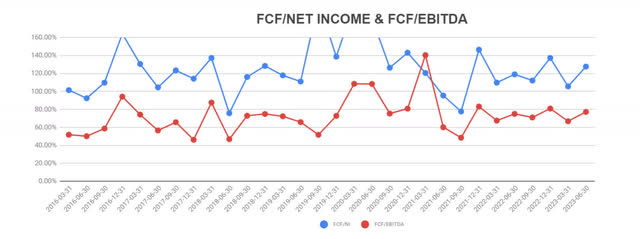
Figur2 2: Free Cash Flow to Net Income and Free Cash Flow to EBITDA Ratios (Author)
Add the consistency of this ratio to an equally consistent revenue CAGR over the years (Figure 3) and to a very tight profit margin no matter the year or quarter we look at, and as long as we can determine future growth with a fairly decent degree of certainty, we have the future cash flows nailed down.

Figure 3: 10 and 5-Year Rolling Revenue CAGR (Author)
How tight is the profit margin? Over the last 30 quarters, the 85% Confidence Interval for this metric is 11.5% to 12.7% with a mean value of 12.1% and a standard deviation of only 0.02%. The histogram covering the period, from March 2016 to June 2023, helps us visualize this stability.
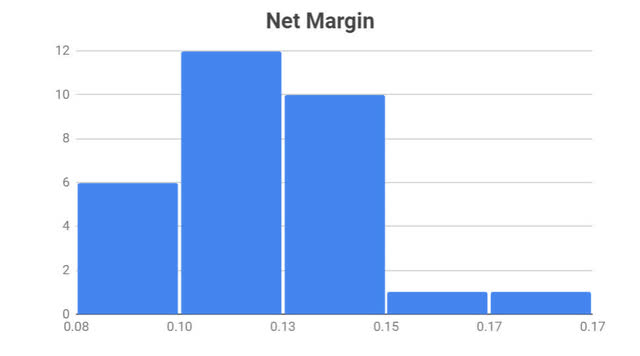
Figure 4: Rollins Net Margin Between 2016 And 2023 (Author)
The result of these almost unnatural metrics is the lockstep moment of revenue, earnings, and free cash flow shown in Figure 5. This is the quintessential high-quality company every investor should be after.
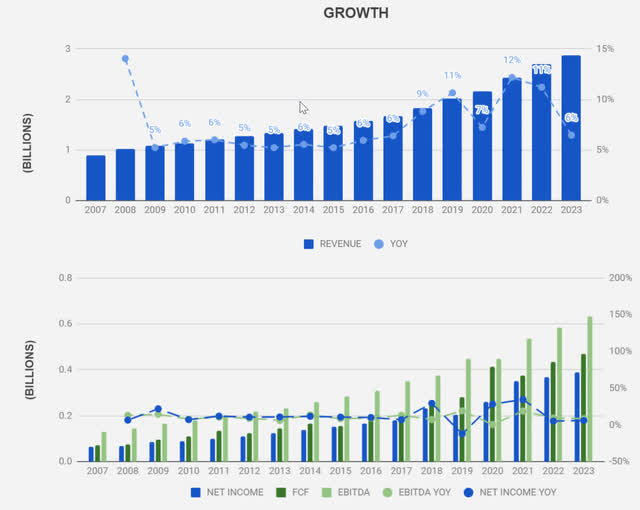
Figure 5: Rollins Revenue, Earnings and Free Cash Flow Growth (Author)
The Growth Model
The short answer: acquisitions. From the company’s latest 10K report:
“Over the last three years, we have completed approximately 100 acquisitions, including 31 acquisitions in 2022.”
From the latest quarterly earnings presentation, the company references 19 acquisitions year to date.
The most notable, and the ones Rollins highlights in its webpage are Allpest in 2014, which opened the doors to the Australian market, Safeguard in 2016 allowing the expansion to the UK market, Northwest Exterminating in 2017, Aardwolf Pestkare in 2018, opening yet another market in Singapore, and Clark Pest Control in 2019. Fox Pest Control is the most recent acquisition.
This can also be seen in Figure 6 (2023 represents the TTM) where there is not a single year without money invested in the purchase of new companies. That is about $1.6 Billion or $136 Million per year. During the same time period, the average annual free cash flow is $250 Million. It seems to be a good strategy as the company seems to spin out enough cash to finance the voracious appetite for gobbling smaller companies.
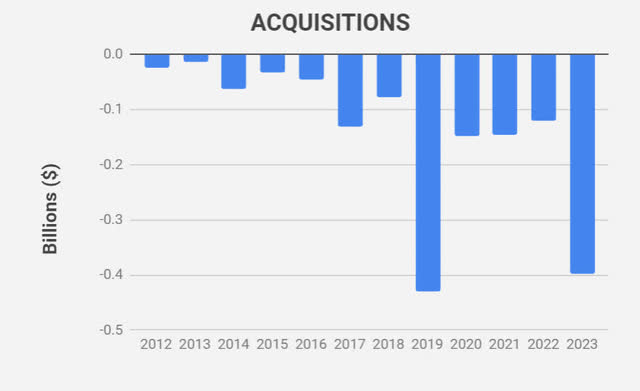
Figure 6: Rollins’ Acquisitions (Author)
However, free cash flow needs to cover other expenses as well. With an incredible 5-year dividend CAGR of 16%, dividends eat about 60% of the hard cash the business generates. Low-ticket acquisitions up until 2017 were no problem, but the more expensive ones clearly need financing from other sources, and for that reason, it is no surprise that debt entered the balance sheet in 2019 (Figure 7). Those $250 Million in yearly free cash flow have not been enough to finance all things at once: acquisitions, buybacks, and dividends. This new debt is not meaningful though. At just 0.58 times EBITDA, it is not raising any red flags. Yet, this is clearly a model that cannot work ad infinitum. Simple math.
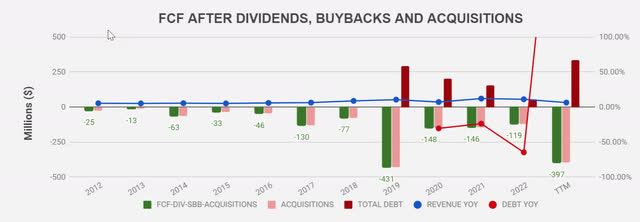
Figure 7: Free Cash Flow, Acquisitions, Dividends and Share Buybacks (Author)
If doubts still existed about the growth model, we can take a closer look at the $1.6 Billion spent on acquisitions and see how it moved the revenue. Sales clocked in at $1.3 Billion in 2012, and in the TTM it topped at $2.7 Billion. And look at that! The difference is roughly $1.6 Billion. If the company were to be left on auto-pilot, with no more acquisitions, and assuming all else remained the same, wouldn’t that be a nice cash machine?
For that reason, the breaking point for the model does not seem to be near. An ROIC near 18% (reaching 20% in some previous years), and a WACC not even half of that, destruction of value is not a concern at all.
The word of caution here is whether the future holds as many gobbling opportunities as the company has encountered thus far. The match seems to hint that growth will come to a halt if those opportunities are not there. The expected growth for the global pest control market is about 6.3% per year up to 2027.
Latest Earnings
As a note, I want to reference the latest earnings, which the company beat on both the top and bottom lines. Revenue grew 15.2% year over year and net income 24.4%. Out of the $110 Million in revenue growth between 2022 and 2023, $51 Million was attributable to acquisitions, according to the latest earnings presentation. In the short term, organic growth looks better than the long-term trend seems to indicate. The results were good nevertheless and management seems focused on continuing the same strategy.
That’s Great, But I’ll Pass
I really like the consistency and high degree of predictability that I see in Rollins. However, the valuation is too high. Instead of trying to come up with a fair value for the stock, I will opt to find out what it takes to make the current share price the intrinsic value from a free cash flow perspective. I start with a free cash flow estimate of $1.02/share, an increase over the TTM $0.95. From Figure 8, we know that free cash flow growth has outpaced revenue growth over both the last 10 and 5-year periods. That is great. I will assume free cash flow growth will remain at the current 12% per year. Then, it’s just time value of money and the choice of the “right” multiple. To make the current share price our “fair value” we need to apply an exit multiple of 25 in 10 years’ time, assuming a discount rate of 10%. I am not using WACC or Cost of Equity (COE) here. I am using the S&P500 thrown-around 10% yearly return instead as a hurdle rate. If we take a look at Figure 8, we also see that the mean price to free cash flow multiple over the last 10 years is 35.73, and that a multiple of 25 is one of the modes in the bimodal distribution for the 10-year period. The 95% confidence interval for the multiple is 35.07 to 36.40, so, a 25 multiple seems a big drop. The same exercise for a 5-year period is on the right of Figure 8.
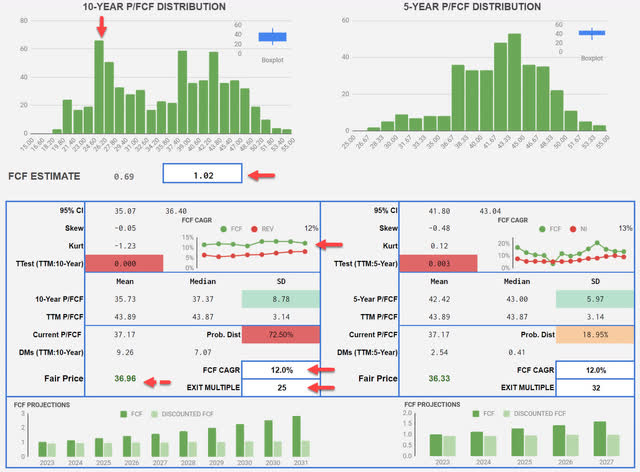
Figure 8: Rollins Fair Value Exercise (Author)
For one thing, I feel hesitant to assume the 12% free cash flow growth will remain. We have seen that growth has gone hand in hand with acquisitions, and I am not sure the rampage can continue for another 10 years. If the acquisitions slow down, growth will too, and unless magic is true, free cash flow growth will drop. Then, as a consequence of possible lower growth, the multiple will have to contract. What number will it contract to? I don’t know, but Apple (AAPL) currently trades at a 26 multiple, Google (GOOG) at about 20 and Microsoft (MSFT) has traded at an average multiple of 26 over the last decade. I know, I know, I am using the finest pest control competitors here… the point is, I am not sure the market will see Rollins in 10 years as a higher quality company than the current tech giants, one deserving a multiple higher than that those companies trade at today. To be fair, the multiple is in line with its competitor Rentokil (RTO).
My main point remains, and it is that I am playing a rosy future without room for anything to go a smidge out of line, and I am not comfortable with those assumptions. I am not arguing for paying less than fair value, but I am not confident I would not be paying too much if I bought at the current price to have returns in line with the market.
If we were to adjust free cash flow growth to about 10%, still above revenue growth and were to apply an exit multiple of 20, the current fair price would be about $27.5 per share. I think this is a more realistic scenario and it still fails to overcome the 10% hurdle rate.
Final Thoughts
Those investors who bought ROL in 2012 have beaten the S&P500. Great investment. The company remains solid and is a predictable free cash flow machine. The growth by-acquisitions strategy has worked very well but the returns for an investment made now require a continuing stream of new acquisitions that may or may not be there. My risk tolerance demands that I keep this company on my watch list until a better opportunity to buy the stock comes up. Rollins is a company that ticks all boxes, except the right valuation.
Read the full article here


