The S&P 500 (SPY) worked its way to another new all-time high of 5189 this week, just above the Fibonacci target of 5179 outlined in my last article. To be honest, I nearly shut down my screens early on Friday as it surged higher – after all, 16 out of the last 18 weekly closes have been higher and Fridays have been particularly strong. But then something different happened – a reversal of 66 points, which took the S&P500 into a lower weekly close. Perhaps more importantly, the “Magnificent 7” lost its general, Nvidia (NVDA).
Friday’s reversal could be significant given the weekly exhaustion signal, or it could just be a brief drop like other corrections since late January (two of the last three corrections lasted only one session). This weekend’s article will look at how to tell these two scenarios apart. Various techniques will be applied to multiple timeframes in a top-down process which also considers the major market drivers. The aim is to provide an actionable guide with directional bias, important levels, and expectations for future price action.
S&P 500 Monthly
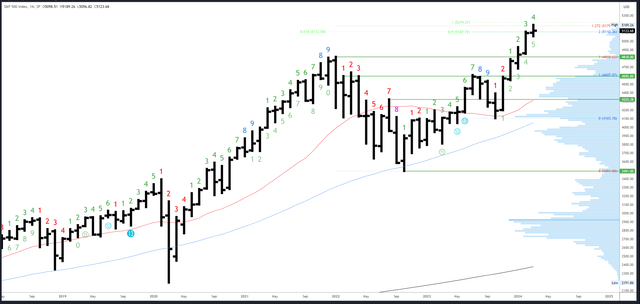
The March bar has now tagged the 5179 level, which is the 127% Fibonacci extension of the 2021-2022 drop. Now that new highs have been made this month, a bearish bar can form quite easily with a drop back into the February range below 5111. However, it would need to close below this level and ideally much lower to cement the reversal pattern.
SPX Monthly (Tradingview)
Above the 5179 Fibonacci extension, there is a measured move at 5219 where the current rally from the October ’23 low will be equal to the October ’22 – July ’23 rally.
The 5096-5111 is the first area of support and could set the bullish/bearish tone for the rest of March. 4818 is the first major level at the previous all-time high.
There will be a long wait for the next monthly Demark signal. March is bar 4 (of a possible 9) in a new upside exhaustion count.
S&P 500 Weekly
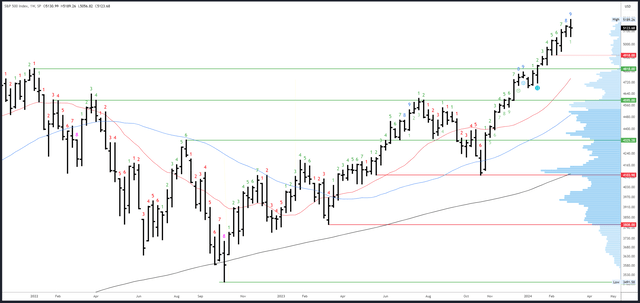
Not only did this week’s bar make a lower close, but it also made a brief lower low. Both were marginal, but this was the first weekly bar with a lower low and lower close since the first week of the year. This signals a change in character, but not an overly bearish one, yet. Indeed, the weekly pattern formed a “doji,” which is a signal of indecision. This can develop into a reversal should the next bars keep making lower highs and then close below the low of 5056.
SPX Weekly (Tradingview)
The 5189 high is the only real resistance.
5048-5056 is a key support area. Below there, we could see 4918-20 quite quickly.
An upside Demark exhaustion count completed on bar 9 (of 9) this week. This usually leads to a pause / dip of several bars (weeks).
S&P 500 Daily
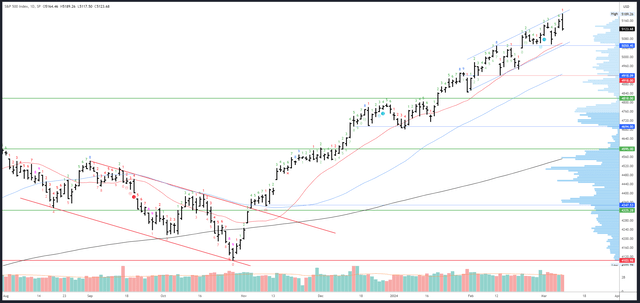
Friday’s reversal came from the top of the daily channel as well as the Fib extension. An “engulfing” bar formed, which is a reliable reversal pattern. Furthermore, the close near the low of the daily range projects continuation early next week.
SPX Daily (Tradingview)
The channel high is potential resistance and will be around 5200 on Monday.
Minor support is 5105-111. Channel support is very near the 20dma around 5060 (and rising).
No daily Demark exhaustion signal can complete next week.
Drivers/Events
Fed Chair Powell’s testimony must have been music to the bulls ears as he stated the Fed expects the “Goldilocks” scenario to play out.
“We expect inflation to come down, the economy to keep growing…If that’s the case, it will be appropriate for interest rates to come down significantly over the coming years,” he said.
Powell’s dovish testimony gave the green light to strong data and another hot Jobs Report would have been another positive for the S&P500. However, the signs of cooling, revisions and weakness in the Household Survey were a negative.
Next week’s focus will be on CPI on Tuesday, which is expected to rise to 0.4% m/m. Inflation readings should be fairly straightforward in terms of market reaction – good news (lower inflation) should be good for the S&P500 and vice versa.
There are two bond auctions due next week on Tuesday and Wednesday. Thursday is busy, with PPI, Retail Sales and Unemployment Claims.
Probable Moves Next Week(s)
Friday’s bearish bar projects some follow through to the downside early next week. The 5105-5111 area is minor support and may lead to a bounce, but as long as lower highs are made with 5189 to preserve the weekly “doji” reversal pattern, then we should see a test of the more important daily channel/20dma and the crucial 5048-5056 area.
Given this area has marked the low in the last two weeks, there is a good chance it breaks on the next test and this should lead to 4918-4920 in the coming weeks. However, I suspect price may spend some time around the 5000 area to create a balanced (volume) profile mid-way between the 4818 break-out and the 5189 high.
Read the full article here


